What Is the Carbon Footprint of Sustainable Energy? A Life-Cycle Assessment


Impactful Ninja is reader-supported. When you buy through links on our site, we may earn an affiliate commission.
Learn more
Learn more
.
Hey fellow impactful ninja ? You may have noticed that Impactful Ninja is all about providing helpful information to make a positive impact on the world and society. And that we love to link back to where we found all the information for each of our posts. Most of these links are informational-based for you to check out their primary sources with one click. But some of these links are so-called "affiliate links" to products that we recommend. First and foremost, because we believe that they add value to you. For example, when we wrote a post about the environmental impact of long showers, we came across an EPA recommendation to use WaterSense showerheads. So we linked to where you can find them. Or, for many of our posts, we also link to our favorite books on that topic so that you can get a much more holistic overview than one single blog post could provide. And when there is an affiliate program for these products, we sign up for it. For example, as Amazon Associates, we earn from qualifying purchases. First, and most importantly, we still only recommend products that we believe add value for you. When you buy something through one of our affiliate links, we may earn a small commission - but at no additional costs to you. And when you buy something through a link that is not an affiliate link, we won’t receive any commission but we’ll still be happy to have helped you. When we find products that we believe add value to you and the seller has an affiliate program, we sign up for it. When you buy something through one of our affiliate links, we may earn a small commission (at no extra costs to you). And at this point in time, all money is reinvested in sharing the most helpful content with you. This includes all operating costs for running this site and the content creation itself. You may have noticed by the way Impactful Ninja is operated that money is not the driving factor behind it. It is a passion project of mine and I love to share helpful information with you to make a positive impact on the world and society. However, it's a project in that I invest a lot of time and also quite some money. Eventually, my dream is to one day turn this passion project into my full-time job and provide even more helpful information. But that's still a long time to go. Stay impactful,Affiliate Disclosure
Why do we add these product links?
What do these affiliate links mean for you?
What do these affiliate links mean for us?
What does this mean for me personally?
![]()
Sustainable energy sources are important when discussing our current climate crisis because they can be used indefinitely. But not all of them are equal in this regard. So, we had to ask: What is the carbon footprint of sustainable energy?
Per kWh produced, sustainable energy sources emit only between 4.5 and 48 gCO2 on a life-cycle basis. Each type (solar, wind, micro/low hydropower, geothermal, tidal, and wave) combats climate change, has various environmental benefits, and produces low levels of greenhouse gas emissions.
Keep reading to learn about the overall carbon footprints of these energies, their carbon footprints throughout their life-cycles, and their environmental benefits and drawbacks.
Here’s How We Assessed the Carbon Footprint of Sustainable Energy
The carbon footprint is one of the ways we measure the effects of human-induced global climate change. It primarily focuses on the GHG emissions associated with consumption, but also includes other emissions such as methane (CH4), nitrous oxide, and chlorofluorocarbons.
“Carbon footprint: the amount of greenhouse gases and specifically carbon dioxide emitted by something (such as a person’s activities or a product’s manufacture and transport) during a given period”
Merriam Webster
Basically, it is the amount of carbon emitted by an activity or an organization. This includes GHG emissions from fuel that we burn directly (e.g., heating a home, driving a car) and GHG emissions from manufacturing the products that we use (e.g., power plants, factories, and landfills).
Sustainable energy sources meet the needs of our current generation without compromising the ability of future generations to meet their own needs. They aim to limit GHGs while preserving the natural integrity of the environment.
“Sustainable: The ability to be maintained at a certain rate or level | Avoidance of the depletion of natural resources in order to maintain an ecological balance”
Oxford Dictionary
An energy source can be sustainable as long as the rate of resource harvest stays below the rate of natural resource replenishment. Harvesting, utilizing, operating, and building infrastructure for renewables are all areas where the energies could become unsustainable.
The 6 types of sustainable energy are: solar, wind, hydropower (micro/low), geothermal, tidal, and wave energy.
To understand the carbon footprint of all energy types, we must assess their life-cycle and each stage’s carbon footprint. This life-cycle assessment (LCA) is a method to evaluate the environmental impacts of products and materials. Over the years, companies have strategically used LCA to research and create more sustainable products. So, we had a look at the LCA for all of the sustainable energy types! (No worries, we’ll link back to each throughout this article.)
This Is the Carbon Footprint of All 6 Types of Sustainable Energy
When discussing the carbon footprint of certain energy types, we must take into account carbon emissions across the energy’s building, operating, and building back phases.
| Type of Energy | Carbon Footprint |
| Solar | Concentrated: 38 gCO2/KWhPV Roof: 41 gCO2/KWhPV Utility: 48 gCO2/KWh |
| Wind | Onshore: 11 gCO2/KWh Offshore: 12 gCO2/KWh |
| Hydropower (Micro/Low) | Low: 4.5-13.6 gCO2/KWh |
| Geothermal | 38 gCO2/KWh |
| Tidal | 22 gCO2/KWh |
| Bonus: Wave | Relatively low, but more research is needed |
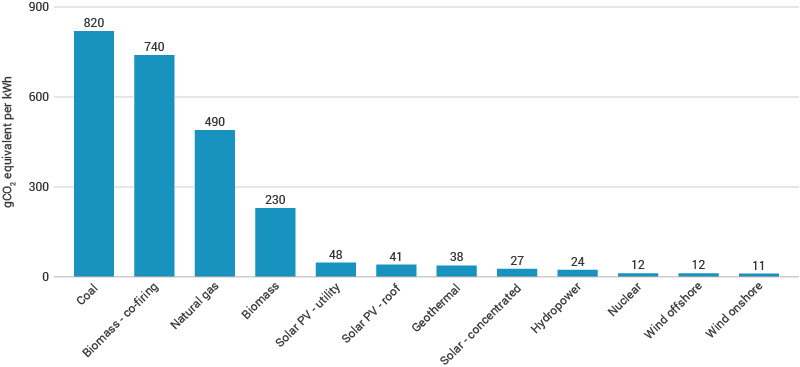
Have a look at the illustration below to see the average life-cycle CO2 equivalent emissions of the sustainable energy sources and how they compare to the other energy types.
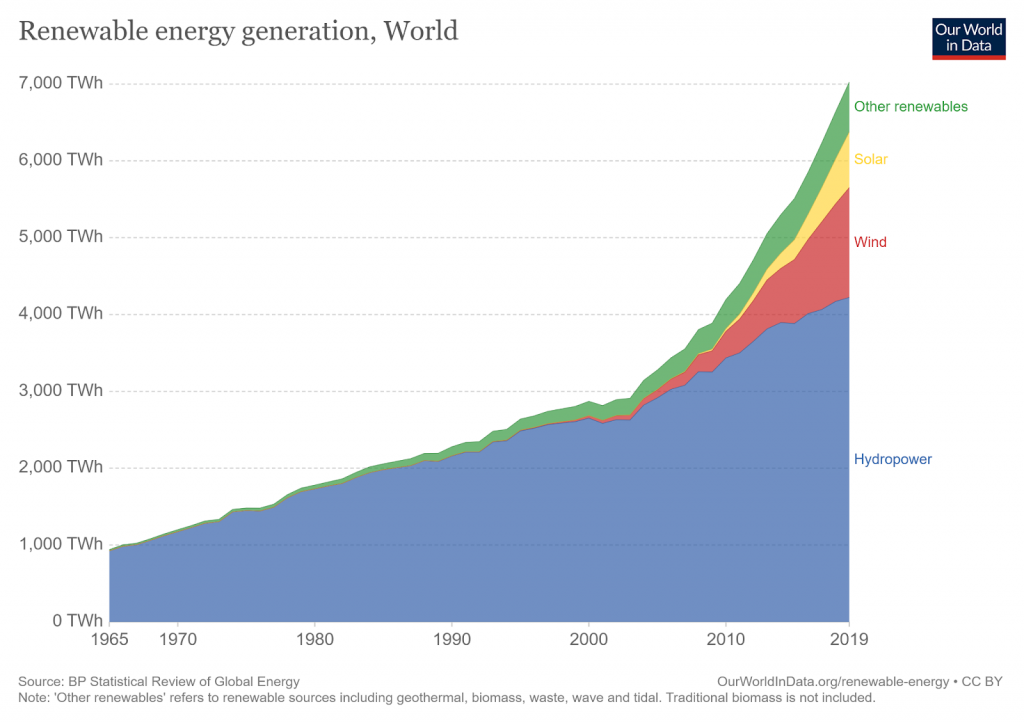
All sustainable energy is by definition also renewable energy. Renewable energy is an energy substitute for fossil fuels (e.g., coal, oil, natural gas) that can reduce the effects of global warming by limiting global greenhouse gas (GHG) emissions. It is infinite by definition because the resources naturally replace themselves over time.
Renewable energy accounted for 11% of total energy consumption in the United States in 2019. This was equal to the amount of coal consumption and was nearly three times greater than consumption in 2000. Experts predict renewable resource consumption will continue to increase through 2050 as more and more effort is put into reducing global GHG emissions.
Solar Energy Emits Between 38 and 48 Grams of CO2/kWh on a Life-Cycle Basis
Solar energy is the conversion of sunlight into electrical energy either through the use of photovoltaic (PV) panels or solar radiation concentrating mirrors. The energy produced is then used to generate electricity or can be stored in batteries or thermal storage for use at a later time.
“Solar Energy: energy that uses the power of the sun to produce electricity”
Cambridge Dictionary
Solar energy has the fifth-lowest carbon footprint. On a life-cycle basis, concentrated solar emits 38, PV roof solar emits 41, and PV utility solar energy emits 48 grams of CO2 equivalent per kWh of electricity produced.
Harnessing the power of the sun falls into two main categories:
- Photovoltaic (PV) solar cells: photovoltaic cells in solar panels absorb energy from sunlight, creating an electrical charge. This charge moves in response to an internal electric field in the cell, causing electricity to flow.
- Concentrating solar thermal plants (CSP): mirrors reflect and concentrate sunlight onto receivers that collect and convert solar energy into heat. This is utilized in very large power plants.
Here are the life-cycle stages of solar energy and each stage’s carbon footprint:
- Building of solar energy: CO2 emissions from the construction of solar power plants and electricity delivery mechanism
- Operating of solar energy: Little to no CO2 emissions or waste products
- Building back of solar energy: CO2 emissions from decommissioning the solar farms and land restoration
Enough sunlight strikes the surface of the earth in an hour and a half to account for the world’s energy consumption in a year. Because solar energy has such a large electricity generation potential, it is important to understand what its carbon footprint is. And how its carbon emissions affect the global climate change process.
Wind Energy Emits 11 to 12 Grams of CO2/kWh on a Life-Cycle Basis
Wind is a form of solar energy that is caused by the uneven heating of the earth’s surface, irregularities of the earth’s surface, and the earth’s rotation. To harness wind energy, the wind turns the turbine blades around a rotor, which spins a generator to create electricity. An average annual wind speed of 9 miles per hour (mph) or 4 meters per second (m/s) for small turbines and 13mph (5.8m/s) for utility-scale turbines is necessary to economically harness wind energy.
“Wind: a current of air moving approximately horizontally, especially one strong enough to be felt”
Cambridge Dictionary
Wind energy has the lowest carbon footprint of all energy types. On a life-cycle basis, onshore wind emits 11 and offshore wind emits 12 grams of CO2 equivalent per kWh of electricity produced.
There are two main types of wind energy:
- Onshore wind energy: Turbines are located on land. Construction, transportation, maintenance cost, and infrastructure needed to transmit electricity from onshore turbines to consumers is low. However, they may be less efficient because onshore wind speed and direction can be unpredictable.
- Offshore wind energy: Turbines are located in the ocean or freshwater. Construction, transportation, maintenance cost, and infrastructure needed to transmit electricity from offshore turbines to consumers is high. Offshore turbines are considerably larger than onshore turbines and can cost up to 20% more. Because wind speed and direction are more constant, the potential for energy generation is much higher. Noise pollution, land use, and wildlife impact concerns are minimal compared to onshore turbines.
Here are the life-cycle stages of wind energy and each stage’s carbon footprint:
- Building of wind energy: CO2 emissions from the construction of wind power plants and electricity delivery mechanism
- Operating of wind energy: Little to no CO2 emissions or waste products
- Building back of wind energy: CO2 emissions from decommissioning the wind turbines and land restoration
The global installed capacity of wind energy increased by a factor of 75 between 1997 and 2018, growing from 7.5 GW to over 564 GW. Because wind energy is one of the cheapest and fastest-growing renewable energy technologies with a low carbon emissions profile, it is important to understand what its carbon footprint is and how its carbon emissions affect the global climate change process.
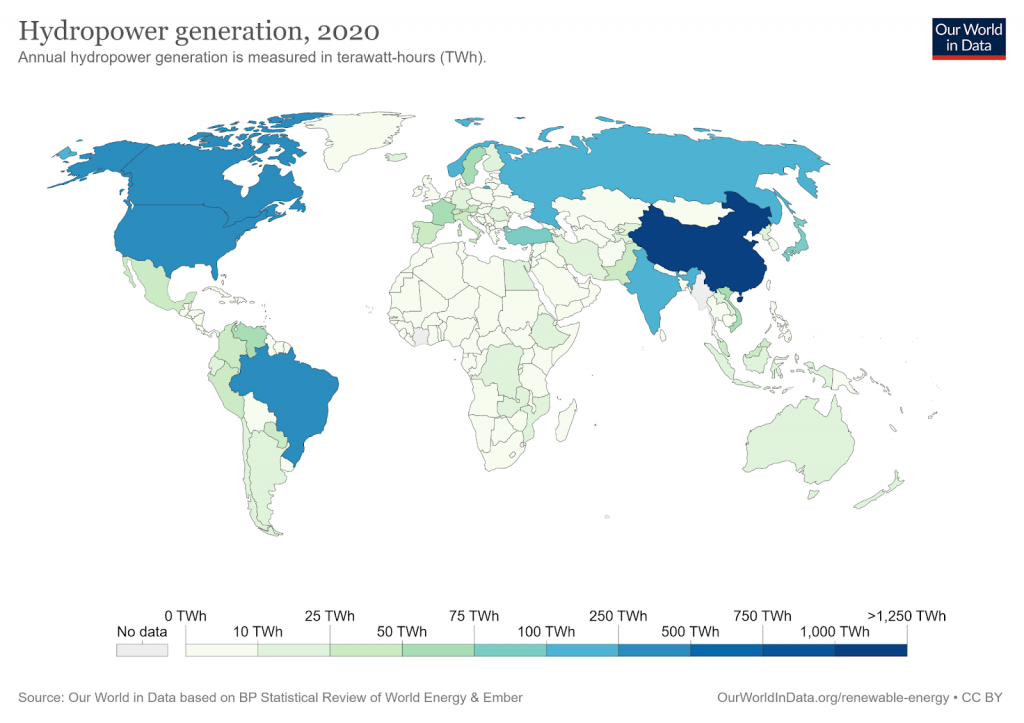
Hydropower Emits 24 Grams of CO2/kWh on a Life-Cycle Basis
Hydropower contributes to the avoidance of GHG emissions from the burning of fossil fuels (e.g. coal) and is classified as a renewable energy source because the resource (water) naturally replaces itself over time. To harness energy from water, flowing water turns turbines and spins a generator to generate electricity.
“Hydropower: hydroelectric power (= the production of electricity by the force of fast-moving water)”
Cambridge Dictionary
Hydropower energy has the fourth-lowest carbon footprint of all energy types. Per kWh produced, hydropower emits 24 grams of carbon dioxide (CO2) on a life-cycle basis.
Hydropower can be divided into three main categories depending on how many megawatts (MW) of power are generated.
| Category of Hydropower | Generating Capacity |
| Micro Hydropower | 100 kilowatts (kW) or less |
| Low-Impact Hydropower (Low Hydro) | Between 100 kW and 10 MW |
| Large Hydropower (Large Hydro) | 30 MW or more |
And those categories can be defined as one of three types of hydroelectric facility:
- Run-of-river: A facility that channels flowing water from a river through a canal or penstock to turn a turbine which spins a generator to produce electricity.
- Storage: A large system that stores water in a reservoir via the use of a dam. Water is released from the reservoir to turn a turbine which spins a generator to produce electricity.
- Pumped storage: A system that harnesses water that is cycled between upper and lower reservoirs by pumps. Water is released from the upper reservoir into the lower reservoir to turn a turbine which spins a generator to produce electricity.
- Offshore: A system that uses tides or waves to generate electricity from seawater. This is the least established form of hydropower.
Here are the life-cycle stages of hydropower and each stage’s carbon footprint:
- Building of hydropower: Construction and transportation of materials, emissions from reservoirs
- Operating of hydropower: Little to no CO2 emissions or waste products
- Building back of hydropower: None, if hydropower infrastructure can be maintained indefinitely
Hydropower makes up more than 60% of global renewable energy generation. Because the amount of GHG emissions from hydropower depends on the scale, it is important to understand what its carbon footprint is and how its carbon emissions affect the global climate change process.
Geothermal Energy Emits 38 Grams of CO2/kWh on a Life-Cycle Basis
The decay of radioactive materials in the rock and fluid of the earth’s core produces geothermal energy. Drilling down to hot water reservoirs up to a mile below the surface creates steam that rotates a turbine, which spins a generator to generate electricity. Geothermal is found along major tectonic plate boundaries where volcanoes are located. Because the Earth has an almost unlimited supply of heat generated by its core, and the water extracted from the reservoirs can be recycled via re-injection into the ground, it is a renewable energy source.
“Geothermal: involving or produced by the heat that is inside the earth”
Cambridge Dictionary
Geothermal energy has the fifth-lowest carbon footprint of all energy types. Per kWh produced, geothermal energy emits 38 grams of CO2 on a life-cycle basis.

The three main types of geothermal power plants are:
- Dry steam: Wells are drilled into underground reservoirs of steam. The steam is piped directly from the well to the power plant where it powers turbines and generators.
- Flash steam: The most common type of geothermal power plant. Very hot (360 degrees Fahrenheit, 182 degrees Celsius) water flows up through wells towards the surface under its own pressure. As it reaches the surface, some of the water boils into steam. The steam is then separated from the water and is then used to power turbines and generators at the power plant.
- Binary steam: Wells are drilled into underground reservoirs of hot water (225-360 degrees Fahrenheit, 107-182 degrees Celsius). The heat from the water is used to boil a working fluid, an organic compound with a low boiling point. This working fluid is vaporized into steam which is then used to power turbines and generators at the power plant. The water is then injected back into the ground where it is reheated and can be used again.
Here are the life-cycle stages of geothermal energy and each stage’s carbon footprint:
- Building of geothermal energy: CO2 emissions from drilling geothermal wells and construction of geothermal power plants
- Operating of geothermal energy: CO2 emissions from the operation of geothermal power plants
- Building back of geothermal energy: Little to no CO2 emissions or waste products
The potential electricity generation for geothermal is 240 GW, with lower and upper limits of 50 GW and 1000-2000 GW, respectively. Because geothermal energy has a large electricity generation potential – and production has steadily increased in the last decade – it is important to understand what its carbon footprint is. And how its carbon emissions affect the global climate change process.
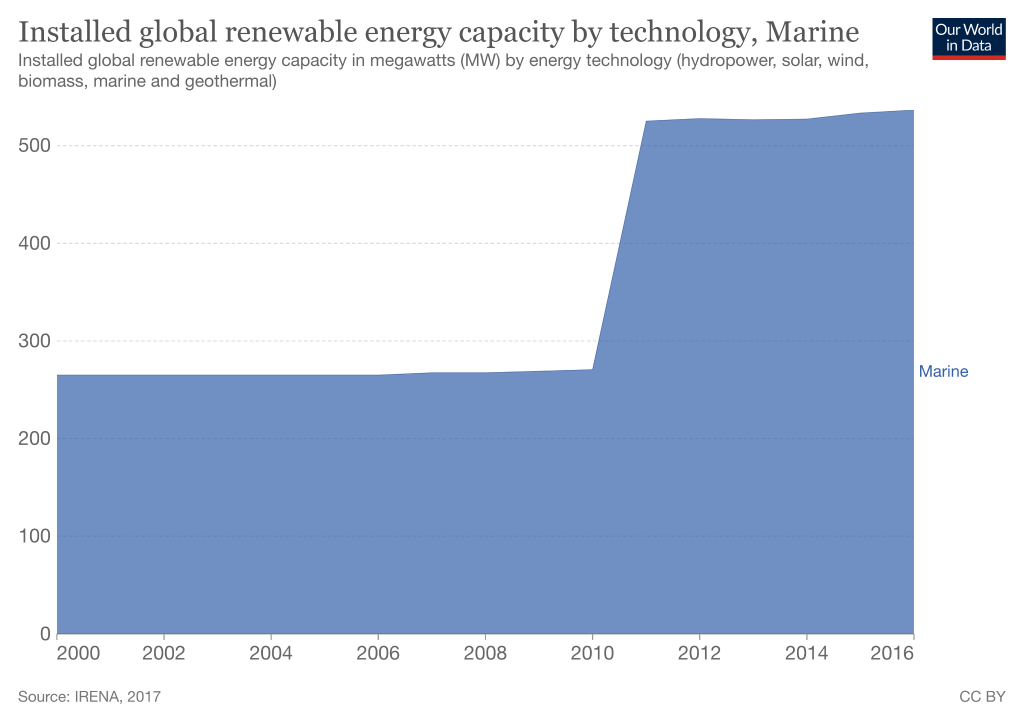
Tidal Energy Emits 22 Grams of CO2/kWh on a Life-Cycle Basis
The gravitational pull of the sun and moon coupled with the rotation of the earth creates tides in the ocean. To produce tidal energy, tidal turbines, barrages, and lagoons use the rise and fall of tides to spin a generator to produce electricity. A minimum tidal range of 10 feet is required to harness tidal energy economically.
“Tidal Power: power that comes from the movement of the tide (= the rise and fall of the ocean that happens twice every day) and that can be used especially for producing electricity”
Cambridge Dictionary
Tidal energy has the third-lowest carbon footprint of all energy types. On a life-cycle basis, tidal energy emits 22 grams of CO2 equivalent per kWh of electricity produced.
There are three types of tidal energy technology:
- Stream: turbines that spin a generator to create electricity are placed in tidal streams.
- Barrage: a barrage (dam) is placed across a river, bay, or estuary. The barrage gates open as the tide rises and close at high tide, creating a lagoon. The water is then released through the turbines which spin a generator to create electricity.
- Lagoon: a body of ocean water is partially enclosed by a man-made barrier. Lagoons function in the same manner as a barrage, but they generate continuous power and can also be constructed along a coastline.
Here are the life-cycle stages of tidal energy and each stage’s carbon footprint:
- Building of tidal energy: CO2 emissions from construction and transportation of materials
- Operating of tidal energy: Little to no CO2 emissions or waste products
- Building back of tidal energy: Theoretically, none as tidal infrastructure can be maintained indefinitely
There are roughly 3,000 GW of energy stored in the world’s tides. Because the generating potential for tidal energy is so high, it is important to understand what its carbon footprint is. And how its carbon emissions affect the global climate change process.
Wave Energy Has One of the Lowest Carbon Footprints, but More Research Is Needed to Determine Exactly How Low It Is
Waves are formed when the wind blows over the surface of the water on oceans or lakes. 95% of the wave’s energy is stored between the surface of the water and the top 1/4th of the wave’s length. To produce wave energy, float/buoy, oscillating water columns, and tapered channel systems use the rise and fall of waves to produce electricity.
“Wave Power: electrical energy generated by harnessing the up-and-down motion of ocean waves”
Britannica
Wave energy has a low carbon footprint. Wave energy emits similarly low levels of CO2 compared to tidal energy, although more research is still needed.
There are three types of wave energy technology:
- Float or buoy: Anchored buoys use the rise and fall of waves to power hydraulic pumps. The “up” and “down” movement powers a generator to produce electricity, which is transported onshore via underwater power cables.
- Oscillating water column: The “in” and “out” motion of waves at the shore enter columns, forcing air to turn turbines. As the waves enter the column, the air is compressed and heated, creating energy. The energy is then transported onshore via underwater power cables.
- Tapered channel (Tapchan): Shore mounted structures channel and concentrate waves, pushing them into an elevated reservoir. The water is then released from the reservoir, flowing through penstocks and to turbines which power a generator to produce electricity.
Here are the life-cycle stages of wave energy and each stage’s carbon footprint:
- Building of wave energy: CO2 emissions from construction and transportation of materials
- Operating of wave energy: Little to no CO2 emissions or waste products
- Building back of wave energy: More research is needed
The market for wave energy is expected to reach $141 million by 2027. Because the generating potential for wave energy is so high, it is important to understand what its carbon footprint is. And how its carbon emissions affect the global climate change process.
What Role Does Sustainable Energy Play in Combating Climate Change
Fossil fuel combustion is the main contributor to atmospheric CO2 levels. Climate Change occurs when CO2 and other air pollutants absorb sunlight and solar radiation in the atmosphere, trapping the heat and acting as an insulator for the planet. Since the Industrial Revolution, Earth’s temperature has risen a little more than 1 degree Celsius (C), or 2 degrees Fahrenheit (F). The current global annual temperature rise is 0.18C, or 0.32F, for every 10 years.
Using sustainable energy (solar, wind, hydropower, geothermal, tidal, and wave energy) instead of fossil fuel energy helps mitigate the following negative effects of climate change:
- Increasing temperatures: Earth’s atmosphere has warmed 1.5℃ since 1880. This may not seem like a lot, but these degrees create regional and seasonal temperature extremes, reduce sea ice, intensify rainfall and drought severity, and change habitat ranges for plants and animals.
- Rising sea levels: Global sea levels have increased approximately 8-9 inches since 1880, displacing people living along coastlines and destroying coastal habitats. Roads, bridges, subways, water supplies, oil and gas wells, power plants, sewage treatment plants, and landfills remain at risk if sea level rise goes unchecked.
- Melting of sea ice: Since 1979 arctic sea ice has declined by 30%. Sea ice plays a major role in regulating the earth’s climate by reflecting sunlight into space and providing habitat for animal species. If all of the glaciers on Earth melted, sea levels would rise by approximately 70 feet, effectively flooding out every coastal city on the planet.
- Changing precipitation patterns: Extreme weather events (e.g., hurricanes, floods, droughts) are becoming more common and more intense. Storm-affected areas will experience increased precipitation and flooding whereas areas located further from storm tracks will experience decreased precipitation and droughts.
- Ocean acidification: The ocean absorbs 30% of the CO2 released into the atmosphere, which decreases the pH (increases the acidity) of the ocean. In the past 200 years, the pH of oceans has decreased by 0.1 pH units, which translates to a 30% increase in acidity. Aquatic life unable to adjust to this rapid acidification will die off. A prime example of this is coral bleaching, where coral expel the algae (zooxanthellae) living in their tissues as a result of changes in temperature, light, or nutrients.
Experts claim that to avoid a future plagued by rising sea levels, acidified oceans, loss of biodiversity, more frequent and severe weather events, and other environmental disasters brought on by the hotter temperatures, we must limit global warming to 1.5C by 2040.
The more we reduce CO2 emissions, the more we slow the rate of temperature rise, sea-level rise, ice melting, and ocean acidification. When these rates are slowed, the earth’s biodiversity does not have to struggle to adapt to temperature and pH changes. People will not be displaced due to the flooding of coastal areas. And icebergs will continue to provide climate regulation.
How Environmentally Friendly Are Sustainable Energy Sources
The overall environmental friendliness of sustainable energy depends on which specific type of energy is being discussed.
“Environmentally friendly: (of products) not harming the environment.”
Cambridge Dictionary
There are collective, as well as unique, benefits and drawbacks to sustainable energy.
What Are Environmental Benefits of Sustainable Energy
All 6 sustainable energies have the following environmental benefits:
- Climate Change mitigation: The above-mentioned energies have an average life-cycle CO2 equivalent emission value between 4.5 and 48 gCO2/KWh, which is much less than, e.g., coal at 820g of CO2 equivalent per kWh. This reduction in CO2 emissions, in turn, reduces the effects of global climate change including increasing temperatures, rising sea levels, melting of sea ice, changing precipitation patterns, and ocean acidification.
- Energy independence: Being able to produce our own electricity in the US without the aid of foreign countries is an important step to help us become more self-sufficient. Former President George W. Bush signed the Energy Independence and Security Act of 2007 to reduce U.S. dependence on oil, expand the production of renewable fuels (and confront global climate change).
- Employment opportunities: The renewable energy sector collectively employed 11.5 million people worldwide in 2019. Renewable energy jobs continue to increase as we start to realize just how beneficial renewable energy is for our environment.
There are also specific benefits unique to each energy type:
- Solar: Throughout its life cycle, concentrated solar energy produces 0.04%, PV roof solar energy produces 0.05%, and PV utility solar energy produces 0.06% of the CO2 emissions per unit of electricity than coal produces.
- Wind: Throughout its life cycle, wind energy produces 0.02% of the CO2 emissions per unit of electricity than coal produces. And after 3 to 6 months of operation, a wind turbine has effectively offset all emissions from its construction, which means it can operate virtually carbon-free for the rest of its lifetime.
- Micro/Low Hydropower: Hydropower has the potential to reduce overall GHG emissions by 5.6 gigatons by 2050, which is equivalent to nearly 1.2 billion passenger vehicles driven in a year. This would also save around $209 billion in damages caused by climate change.
- Geothermal: Throughout its life cycle, geothermal energy produces 5% of the CO2 emissions per unit of electricity that coal produces. In the US alone, annual geothermal energy resources effectively offset the emission of 4.1 million metric tons (t) of CO2, 200,000 t of SO2, 80,000 t of nitrogen oxides, and 110,000 t of particulate matter when compared to conventional coal-fired plants.
- Tidal and Wave: Tidal energy produces 0.03% of the CO2 emissions per unit of electricity that coal produces, and wave energy also produces low levels of emissions. Tidal and wave energy could help reduce global CO2 emissions from fossil fuel electricity generation by around 500 million tons by the year 2050.
What Are Environmental Drawbacks of Sustainable Energy
- Solar: The scale of land degradation and habitat loss depends on the technology, site topography, and intensity of the solar resource. Siting large-scale solar farms on abandoned land and small-scale farms on top of buildings or homes can minimize negative environmental impacts. Water is used for the construction of PV components, and CSPs require water for cooling. Hydrochloric acid, sulfuric acid, nitric acid, hydrogen fluoride, 1,1,1-trichloroethane, and acetone are all used to manufacture PV cells. If not handled and disposed of properly, these hazardous materials could present a serious risk to environmental and public health.
- Wind: Wind farms use a substantial amount of land, but the areas between and around turbines can be used for livestock grazing, agriculture, highways, and hiking trails. Turbine blades are large and can pose a threat to flying wildlife such as birds and bats. Extensive research and technological advances have reduced turbine-caused wildlife death. Turbines can also cause mechanical and aerodynamic noise pollution when constructed close to residential areas. Siting wind farms in remote locations or on abandoned lands can reduce this effect.
- Micro/Low Hydropower: Hydropower can affect aquatic organisms by interfering with fish migration, blocking movement up/downstream, and altering water flow patterns and quality conditions. Hydropower reservoirs can retain so much water that the water body below the dam dries up. Diversion projects take water away from the river and return it to the river downstream. The water released from the dam may experience changes in temperature and dissolved oxygen concentration.
- Geothermal: Geothermal reservoirs occur deep underground and are not detectable from the surface. Areas where geothermal does come to the surface are only found near tectonic plate boundaries. Also, high-pressure fluid injections close to neighboring fault lines have the potential to trigger earthquakes. 90% of all earthquakes occur in the Ring of Fire, an area that coincides with the highest concentration of geothermal resources.
- Tidal and wave: The main environmental concern with tidal and wave energy is the impact on aquatic wildlife. Construction and operation of marine energy technology may negatively impact estuarine ecosystems via underwater noise pollution, habitat changes, and wildlife collisions with turbines. Because tidal and wave energy is a relatively new technology, more research needs to be done to fully understand this environmental impact.
Final Thoughts
Solar, wind, micro/low hydropower, geothermal, tidal, and wave energy are sustainable energy sources with a low carbon footprint across the building, operating, and building back phases compared to all other energy sources. They combat global warming and have various other environmental benefits including energy independence and job creation. Our atmosphere and Earth’s biota benefit when we use these energy sources instead of traditional fossil fuels.
Carbon emissions have devastating effects on the environment. Reducing our carbon footprint is important because it mitigates the effects of climate change, which has a positive cascade effect on public health and plant and animal diversity. In addition, this boosts the global economy and leads to innovative, more environmentally-friendly solutions.
Stay impactful,

Sources
- McGill: What is Sustainability?
- Impactful Ninja: Sustainable vs Unsustainable – What’s the Difference?
- Impactful Ninja: What is the Carbon Footprint of Solar Energy?
- Impactful Ninja: What is the Carbon Footprint of Wind Energy?
- Impactful Ninja: What is the Carbon Footprint of Hydropower Energy?
- Impactful Ninja: What is the Carbon Footprint of Geothermal Energy?
- Impactful Ninja: What Is the Carbon Footprint of Tidal Energy and Wave Energy?
- Britannica: Carbon Footprint
- United States Environmental Protection Agency: System of Registries
- World Nuclear Association: Average life-cycle CO2 equivalent emissions
- Scholar Schools: Advantages and Disadvantages
- Impactful Ninja: What is the Carbon Footprint of Fossil Fuels?
- Impactful Ninja: What is the Carbon Footprint of Coal Energy?
- Impactful Ninja: What is the Carbon Footprint of Oil Energy?
- Impactful Ninja: What is the Carbon Footprint of Natural Gas?
- U.S. Energy Information Administration: Renewable Energy Explained
- Our World in Data: Modern Renewable Energy Consumption
- Office of Energy Efficiency & Renewable Energy: How Does Solar Work?
- Our World in Data: Solar Power Generation
- International Renewable Energy Agency: Solar Energy
- Office of Energy Efficiency & Renewable Energy: Solar Photovoltaic Technology Basics
- The National Renewable Energy Laboratory: Best Practices at the End of the Photovoltaic System Performance Period
- Office of Energy Efficiency & Renewable Energy: How Do Wind Turbines Work?
- US Energy Information Administration: Wind Explained – Where Wind Power is Harnessed
- Our World in Data: Wind power generation
- Kiwi Energy: Differences Between Onshore & Offshore Wind Energy
- Electrical Academia: Wind Turbine Parts and Functions
- Office of Energy Efficiency & Renewable Energy: How a Wind Turbine Works – Text Version
- International Renewable Energy Agency: Wind Energy
- United Nations Framework Convention on Climate Change: How Hydropower Can Help Climate Action
- Office of Energy Efficiency & Renewable Energy: How Hydropower Works
- Our World in Data: Hydropower generation, 2020
- Office of Energy Efficiency & Renewable Energy: Types of Hydropower
- International Hydropower Association: Types of hydropower
- International Hydropower Association: Hydropower’s Carbon Footprint
- The Constructor: Components of a Hydropower Plant and Their Functions
- VGB PowerTech: Hydropower Fact Sheets
- TWI: What is Geothermal Energy? How Does it Work?
- National Renewable Energy Laboratory: Geothermal Electricity Production Basics
- Our World in Data: Installed Geothermal Capacity
- Office of Energy Efficiency and Renewable Energy: Handbook of Best Practices for Geothermal Drilling
- Energy Education: Geothermal Power Plants
- Resources for the Future: Geothermal Energy 101
- International Renewable Energy Agency: Geothermal Power – Technology Brief
- Statista: Global geothermal energy capacity from 2009 to 2020
- U.S. Energy Information Administration: Hydropower Explained – Tidal Power
- Our World in Data: Installed Global Renewable Energy Capacity by Technology, Marine
- National Geographic: Tidal Energy
- Power Technology: Riding the renewable wave: tidal energy advantages and disadvantages
- Britannica: Tidal Power
- U.S. Energy Information Administration: Hydropower Explained – Wave Power
- International Renewable Energy Agency: Wave Energy Technology Brief
- Ocean Energy Council: Wave Energy
- Allied Market Research: Wave Energy Market Size, Share Analysis – 2027
- Union of Concerned Scientists: The Hidden Costs of Fossil Fuels
- National Resources Defense Council: Global Warming 101
- The National Wildlife Federation: Climate Change
- National Oceanic and Atmospheric Administration: Climate Change – Global Temperature
- National Oceanic and Atmospheric Administration: Climate Change – Global Sea Level
- United States Geological Survey: How would sea level change if all glaciers melted?
- National Aeronautics and Space Administration, U.S.A.: How does climate change affect precipitation?
- National Oceanic and Atmospheric Administration: Ocean Acidification
- National Ocean Service: What is coral bleaching?
- United Nations Framework Convention on Climate Change: The Paris Agreement
- US Environmental Protection Agency: Summary of the Energy Independence and Security Act
- White House Archives: Fact Sheet – Energy Independence and Security Act of 2007
- International Renewable Energy Agency: Renewable Energy Jobs Continue Growth to 11.5 Million Worldwide
- Wind Power Works: Wind power is crucial for combating climate chang
- U.S. Department of Energy: Hydropower Vision – New Report Highlights Future Pathways for U.S. Hydropower
- National Renewable Energy Laboratory: Buried Treasure – The Environmental, Economic, and Employment Benefits of Geothermal Energy
- U.S. Government Accountability Office: Science & Tech Spotlight – Renewable Ocean Energy
- Union of Concerned Scientists: Environmental Impacts of Solar Power
- Union Of Concerned Scientists: Environmental Impacts of Wind Power
- Office of Energy Efficiency and Renewable Energy: Environmental Impacts and Siting of Wind Projects
- National Hydropower Association: Environmental Mitigation Technology for Hydropower
- US Energy Information Administration: Geothermal explained – Where geothermal energy is found
- Nature: South Korea accepts geothermal plant probably caused destructive quake
- United States Geological Survey: Earthquake Glossary – Ring of Fire