What Is the Carbon Footprint of Blueberries? A Life-Cycle Analysis


Impactful Ninja is reader-supported. When you buy through links on our site, we may earn an affiliate commission.
Learn more
Learn more
.
Hey fellow impactful ninja ? You may have noticed that Impactful Ninja is all about providing helpful information to make a positive impact on the world and society. And that we love to link back to where we found all the information for each of our posts. Most of these links are informational-based for you to check out their primary sources with one click. But some of these links are so-called "affiliate links" to products that we recommend. First and foremost, because we believe that they add value to you. For example, when we wrote a post about the environmental impact of long showers, we came across an EPA recommendation to use WaterSense showerheads. So we linked to where you can find them. Or, for many of our posts, we also link to our favorite books on that topic so that you can get a much more holistic overview than one single blog post could provide. And when there is an affiliate program for these products, we sign up for it. For example, as Amazon Associates, we earn from qualifying purchases. First, and most importantly, we still only recommend products that we believe add value for you. When you buy something through one of our affiliate links, we may earn a small commission - but at no additional costs to you. And when you buy something through a link that is not an affiliate link, we won’t receive any commission but we’ll still be happy to have helped you. When we find products that we believe add value to you and the seller has an affiliate program, we sign up for it. When you buy something through one of our affiliate links, we may earn a small commission (at no extra costs to you). And at this point in time, all money is reinvested in sharing the most helpful content with you. This includes all operating costs for running this site and the content creation itself. You may have noticed by the way Impactful Ninja is operated that money is not the driving factor behind it. It is a passion project of mine and I love to share helpful information with you to make a positive impact on the world and society. However, it's a project in that I invest a lot of time and also quite some money. Eventually, my dream is to one day turn this passion project into my full-time job and provide even more helpful information. But that's still a long time to go. Stay impactful,Affiliate Disclosure
Why do we add these product links?
What do these affiliate links mean for you?
What do these affiliate links mean for us?
What does this mean for me personally?
![]()
Blueberries are a popular American fruit, with almost 700 million lbs of them produced every year. They are an amazing addition to baked goods and pack a strong nutritional punch with lots of antioxidants and vitamin K. But, blueberries can also have a significant impact on the planet. Many of the resources required to produce them can cause a lot of carbon emissions. So, we had to ask: What is the carbon footprint of blueberries?
Blueberries have a high carbon footprint of 0.45kg (1lb) of CO2e per pound of blueberries. This is mainly because of their high pesticide use, mechanized farming methods, refrigerated transportation, and use of plastic packaging. Their footprint is significant compared to other fruits.
In this article, we will look at the full life-cycle of blueberries, investigating how each stage contributes to their carbon footprint. We will go through all of the main stages of blueberries’ production—starting with growth and then going through harvesting, processing, transportation, and ending at waste disposal—and will evaluate how each stage contributes to blueberries’ carbon footprint. So, let’s get into the carbon footprint of blueberries!
Here’s How We Assessed the Carbon Footprint of Blueberries
The carbon footprint is one of the ways we measure the effects of our human-induced global climate change. It primarily focuses on the greenhouse gas (GHG) emissions associated with consumption, but also includes other emissions such as methane (CH4), nitrous oxide, and chlorofluorocarbons, and is generally expressed in carbon dioxide equivalents (CO2e).
“Carbon footprint: the amount of greenhouse gases and specifically carbon dioxide emitted by something (such as a person’s activities or a product’s manufacture and transport) during a given period”
Merriam Webster
Basically, it is the amount of carbon emitted by you as an individual or an organization providing you with goods and services – including blueberries:
- This includes GHG emissions from producing the products that we use and foods that we eat (e.g., power plants, factories or farms, and landfills)
- GHG emissions from fuel that we burn directly or indirectly (e.g., logistics and transportation, cooling or heating facilities),
- as well as the GHG emissions attributed to how we consume these products and foods.
To understand the carbon footprint of blueberries, we must assess their life-cycle and each stage’s sustainability. This life-cycle assessment (LCA) is a method to evaluate the environmental impacts of products and materials.
Here’s the Overall Carbon Footprint of Blueberries
The overall carbon footprint of blueberries is 0.45kg (1lb) of CO2e per pound of blueberries. The main factors that contribute to this are the mechanized methods used during the farming process, high pesticide use, and the use of plastic packaging.
The carbon footprint of blueberries is high when compared with other fruits. However, there are a few factors that impact this, including the amount and type of pesticides used, distance of transportation, and the amount of packaging used.
| The carbon footprint of blueberries | 0.45kg (1lb) of CO2e per pound of blueberries |
So, let’s have a look at each stage of the LCA of blueberries!
| The life-cycle stages of blueberries | Each stage’s carbon footprint |
| Growing of blueberries | The carbon footprint of growing blueberries is high. This is mainly because of their long maturation times, low yield per hectare, and extreme use of pesticides. |
| Harvesting, processing, and packaging of blueberries | The carbon footprint of harvesting, processing, and packaging blueberries is high. The main factors that contribute to this are the energy use caused by mechanized farming methods and the emissions created by plastic packaging. |
| Transporting of blueberries | Transporting blueberries has a moderate carbon footprint. Most blueberries are produced domestically, however, they require refrigeration during transport which creates significant carbon emissions. |
| End-of-life of blueberries | The carbon footprint of the end-of-life of blueberries can be quite low, depending on the type of packaging used. This is mainly because blueberries have recyclable packaging options and no natural waste. |
Blueberries create the most emissions in the first half of their journey. Factors like orchard density, pesticides, mechanized farming processes, and packaging are some of the most significant contributors to their carbon footprint. The second half of the journey has some notable contributors, namely refrigerated trucking, but in general these stages have less impact on the high carbon footprint of blueberries.
What Is the Carbon Footprint of Growing Blueberries
The carbon footprint of growing blueberries is high. This is mainly because of their long maturation times, low yield per hectare, and extreme use of pesticides.
The process of growing blueberries generally has a high carbon footprint, depending on the methods used. Factors like the amount of irrigation, deforestation, and pesticide use can all contribute to the overall impact of the growth stage.
Which factors impact the carbon footprint of growing blueberries?
- How do blueberries grow: Blueberries grow on bushes that are farmed into rows. Blueberry bushes have natural carbon sequestering properties, meaning that they offset some of their own emissions at this stage. Therefore, the growth method of blueberries does not contribute significantly to their carbon footprint.
- What is the growth duration of blueberries: The longer the growth frame, the higher the carbon footprint because more resources are required to sustain the plants. Blueberry bushes take around 2 years to start bearing fruit and up to 4 years before they produce at peak capacity. Individual blueberries are usually ready to pick in late spring or early summer, with a 3–4 month growth period. These growth times are fairly average amongst fruits, meaning this part of the process contributes moderately to their overall carbon footprint.
- What is the land usage of blueberries: When fruits use less land, they require less deforestation and resources to sustain them. Blueberries yield between 10–15 tons per hectare. This is a low to average yield compared to other fruits, so this stage contributes moderately to their carbon footprint.
- What is the water usage of blueberries: Blueberries need around an inch of water per week. Blueberries grow all over the US, but mostly in the state of Washington. Washington can get anywhere from 70–150 inches of rain a year, depending on the area, which means that blueberries’ water needs are well taken care of. So, water usage doesn’t contribute to their overall carbon footprint.
- What is the pesticide and fertilizer usage of blueberries: Blueberries have been named one of the worst pesticide offenders. Pesticides create a significant amount of emissions, so this stage does contribute to the overall carbon footprint.
The growth methods of blueberries contribute considerably to their overall carbon footprint. They have a long growth time, a low yield per hectare, and use copious amounts of pesticides. Because of these factors, their growth footprint is fairly high.
In short, growing blueberries has a significant carbon footprint. The main factors causing this are the time they take to grow, the low density of their orchards, and their incredibly high pesticide use.
What Is the Carbon Footprint of Harvesting, Processing, and Packaging Blueberries
The carbon footprint of harvesting, processing, and packaging blueberries is high. The main factors that contribute to this are the energy use caused by mechanized farming methods and the emissions created by plastic packaging.
The next major stage in the life-cycle of blueberries’ carbon emissions is harvesting, processing, and packaging. This involves picking the fruit, checking it for damage, sorting it, and getting it ready for distribution. This stage can contribute greatly to the carbon footprint of the fruit depending on the processes used.
Which factors impact the carbon footprint of harvesting, processing, and packaging blueberries?
- How are blueberries harvested: Many blueberries are machine harvested these days. Harvesting machines require energy to run, and so this part of the process does contribute significantly to blueberries’ carbon footprint.
- How are blueberries processed: Due to increased demand, blueberries are typically processed mechanically. Because this requires energy to run, it also contributes to their carbon footprint.
- How are blueberries packaged: Blueberries are typically packaged in either cardboard trays or plastic clamshells. Both cardboard and plastic create carbon emissions during their production. Therefore, this stage is a major contributor to blueberries’ carbon footprint.
By all counts, the harvesting, processing, and packaging stage has a major impact on blueberries’ carbon footprint. The mechanized harvesting and processing, as well as significant packaging really drives up their carbon footprint here.
In short, this stage of the process is a major contributor to blueberries’ overall carbon footprint. This is mainly because of mechanization during their harvesting and processing stages and their high packaging use.
What Is the Carbon Footprint of Transporting Blueberries
Transporting blueberries has a moderate carbon footprint. Most blueberries are produced domestically, however, they require refrigeration during transport which creates significant carbon emissions.
Blueberries’ journeys have just started when they are packaged. They then have to travel the distance between the farm and the grocery store. The distance, as well as the method through which they have to travel, are the two most important factors in determining the carbon footprint of their transportation.
Which factors impact the carbon footprint of transporting blueberries?
- Where are blueberries grown: Most blueberries consumed in America are domestically produced. They are grown all over the country, with Washington, Michigan, Georgia, Oregon, and New Jersey being the main producers. With this even distribution throughout the country, most Americans are likely to get fairly local blueberries. Thus, the transport distance does not contribute significantly to blueberries’ carbon footprint.
- How are blueberries transported: Blueberries are transported using refrigerated trucks. Refrigerated trucks use more fuel than unrefrigerated trucks, meaning that this stage contributes significantly to blueberries’ carbon footprint.
Transporting blueberries comes at a moderate carbon cost. They require refrigerated trucking, but because they don’t have a long distance to travel, the cost is not too high.
In short, the domestic production of blueberries means that their transportation carbon footprint is moderate. The refrigerated trucks do contribute significantly, but given they aren’t traveling as far, their emissions are mitigated.
What Is the Carbon Footprint of the End-of-Life of Blueberries
The carbon footprint of the end-of-life of blueberries can be quite low, depending on the type of packaging used. This is mainly because blueberries have recyclable packaging options and no natural waste.
Blueberries’ carbon footprint journey isn’t done after you consume them. In fact, one of the most important factors that will determine the overall carbon footprint of blueberries is how their waste is disposed of. Here, we will look at how this stage in the process affects blueberries’ carbon footprint.
Which factors impact the carbon footprint of the end-of-life of blueberries?
- How are blueberries disposed of: Blueberries, for the most part, don’t have any pits or peels that can’t be eaten, so organic waste should be minimal. However, food waste due to spoilage is common, with estimates as high as 30–40%. This is especially bad because 96% of food waste ends up in landfills. Furthermore, food waste is particularly harmful to the environment as it releases a greenhouse gas called methane when it is put in landfills. But overall, if you are actually eating your blueberries, this stage does not contribute significantly to blueberries’ carbon footprint.
- How is the packaging of blueberries disposed of: The two main packaging materials for blueberries—cardboard and plastic—have differing disposal methods. Cardboard has a very high recycling rate at 89%, whereas plastic has a very low recycling rate at 9%. Therefore, the footprint of this stage will largely depend on what kind of packaging your blueberries come in.
The amount and type of waste that blueberries create can vary greatly. However, if they are consumed completely and bought in recyclable cardboard containers, the carbon footprint of this stage can be quite low.
In short, the end-of-life of blueberries has a fairly low carbon footprint. Non-wasted blueberries and those that come in cardboard rather than plastic packaging will have the lowest footprint.
How Does the Carbon Footprint of Blueberries Compare to Other Types of Food
Blueberries rank fairly highly when compared to other foods in general. When kilocalories are taken into account, their comparatively low-calorie density means that they are still less carbon efficient.
Blueberries have a fairly high carbon footprint in relation to other foods. When assessing the carbon footprint of a particular food, it is always important to place it in the context of other foods. This can help you to see the relative impact they have and assist you in making decisions between different foods based on their carbon footprint. In this next part of the article, we will show you how blueberries compare to other foods in terms of carbon footprint.
How Does the Carbon Footprint of Blueberries Compare to Other Types of Fruits
Blueberries have a high carbon footprint when compared to other fruits. Fruits in general, tend to have lower carbon footprints than many other foods, like dairy products. However, there is still a lot of variation between them. Different transportation distances, the density of orchards, variations in growing methods, and pesticide use can all add up to contribute to their carbon footprints. Here, we will look at how blueberries compare specifically to other fruits in terms of carbon footprint.
| Fruits | Carbon Footprint per lbs | Calories per lbs | Carbon Footprint per Calories |
| Avocados | 0.85 kg (1.9 lb) of CO2e per pound of avocados | 725 calories per pound | 1.17kg (2.57lb) of CO2e per 1,000 calories of avocados |
| Grapes | 0.64 kg (1.42 lbs) of CO2e per pound of grapes | 300 calories per pound | 2.13kg (4.7lb) of CO2e per 1,000 calories of grapes |
| Cantaloupes | 0.58kg (1.3lb) of CO2e per pound of cantaloupe | 154 calories per pound | 3.77kg (8.31lb) of CO2e per 1,000 calories of cantaloupes |
| Kiwis | 0.56kg (1.24lb) of CO2e per pound of kiwis | 277 calories per pound | 2.02kg (4.45lb) of CO2e per 1,000 calories of kiwis |
| Blueberries | 0.45kg (1lb) of CO2e per pound of blueberries | 256 calories per pound | 1.75kg (3.86lb) of CO2e per 1,000 calories of blueberries |
| Plums | 0.4 kg (0.88 lb) CO2e per pound of plums | 209 calories per pound | 1.91kg (4.21lb) of CO2e per 1,000 calories of plums |
| Strawberries | 0.39kg (0.88lb) of CO2e per pound of strawberries | 145 calories per pound | 2.69kg (5.93lb) of CO2e per 1,000 calories of strawberries |
| Pomegranates | 0.39kg (0.87lb) of CO2e per pound of pomegranates | 375 calories per pound | 1.04kg (2.29lb) of CO2e per pound of pomegranates |
| Figs | 0.3kg (0.68lb) of CO2e per pound of figs | 333 calories per pound | 0.9kg (1.98lb) of CO2e per 1,000 calories of figs |
| Papayas | 0.3kg (0.67lb) of CO2e per pound of papayas | 195 calories per pound | 1.54kg (3.4lb) of CO2e per 1,000 calories of papayas |
| Oranges | 0.3kg (0.66 lb) CO2e per pound of oranges | 213 calories per pound | 1.41kg (3.11lb) of CO2e per 1,000 calories of oranges |
| Dates | 0.27kg (0.6lb) of CO2e per pound of dates | 1,300 calories per pound | 0.21kg (0.46lb) of CO2e per 1,000 calories of dates |
| Apples | 0.24 kg (0.53 lb) of CO2e per pound of apples | 236 calories per pound | 1.02kg (2.25lb) of CO2e per 1,000 calories of apples |
| Pears | 0.23kg (0.52 lb) of CO2e per pound of pears | 259 calories per pound | 0.89kg (1.96lb) of CO2e per 1,000 calories of pears |
| Bananas | 0.21 kg (0.48 lb) of CO2e per pound of banana | 404 calories per pound | 0.52kg (1.15lb) of CO2e per 1,000 calories of bananas |
| Mangoes | 0.21 kg (0.46 lb) CO2e per pound of mangoes | 272 calories per pound | 0.77lb (1.7lb) of CO2e per 1,000 calories of mangoes |
| Cherries | 0.19kg (0.41 lb) of CO2e per pound of cherries | 227 calories per pound | 0.84kg (1.85lb) of CO2e per 1,000 calories of cherries |
| Limes | 0.18kg (0.39lb) of CO2e per pound of limes | 136 calories per pound | 1.32kg (2.91lb) of CO2e per 1,000 calories of limes |
| Peaches | 0.17kg (0.38lb) CO2e per pound of peaches | 176 calories per pound | 0.97kg (2.14lb) of CO2e per 1,000 calories of peaches |
| Apricots | 0.16kg (0.36lb) of CO2e per pound of apricots | 218 calories per pound | 0.73kg (1.61lb) of CO2e per 1,000 calories of apricots |
| Raspberries | 0.15kg (0.33lb) of CO2e per pound of raspberries | 240 calories per pound | 0.63kg (1.39lb) of CO2e per 1,000 calories of raspberries |
| Pineapples | 0.09 kg (0.20 lb) of CO2e per pound of pineapple | 227 calories per pound | 0.4kg (0.88lb) of CO2e per 1,000 calories of pineapples |
| Lemons | 0.09kg (0.19lb) CO2e per pound of lemons | 132 calories per pound | 0.68kg (1.5lb) of CO2e per 1,000 calories of lemons |
| Grapefruit | 0.08kg (0.18lb) of CO2e per pound of grapefruit | 191 calories per pound | 0.42kg (0.93lb) of CO2e per 1,000 calories of grapefruits |
| Blackberries | 0.07kg (0.15lb) of CO2e per pound of blackberries | 195 calories per pound | 0.36kg (0.79lb) of CO2e per 1,000 calories of blackberries |
| Clementines | 0.06 kg (0.13 lb) CO2e per pound of clementines | 213 calories per pound | 0.28kg (0.62kg) of CO2e per 1,000 calories of clementines |
| Watermelons | 0.05kg (0.11 lb) of CO2e per pound of watermelon | 136 calories per pound | 0.37kg (0.82lb) of CO2e per 1,000 calories of watermelons |
Blueberries rank near the top of this chart when compared to other popular fruits. Though their carbon footprint is almost half that of the top offender—avocados—they still create far more emissions than most other fruits. For example, they have eight times the emissions of the lowest fruits—clementines and watermelons. Clearly, blueberries are not the most carbon-conscious of fruits.
How Does the Carbon Footprint of Blueberries Compare to Other Types of Food in General
Branching outside the world of fruit, blueberries also have a fairly high footprint among food in general. In terms of their carbon footprint in relation to kilocalories, they have a moderate to high carbon footprint compared to other foods.
When it comes to greenhouse gas emissions (GHG), foods are often compared in terms of emissions per 1,000 kilocalories (as opposed to their weight in lbs or kg).
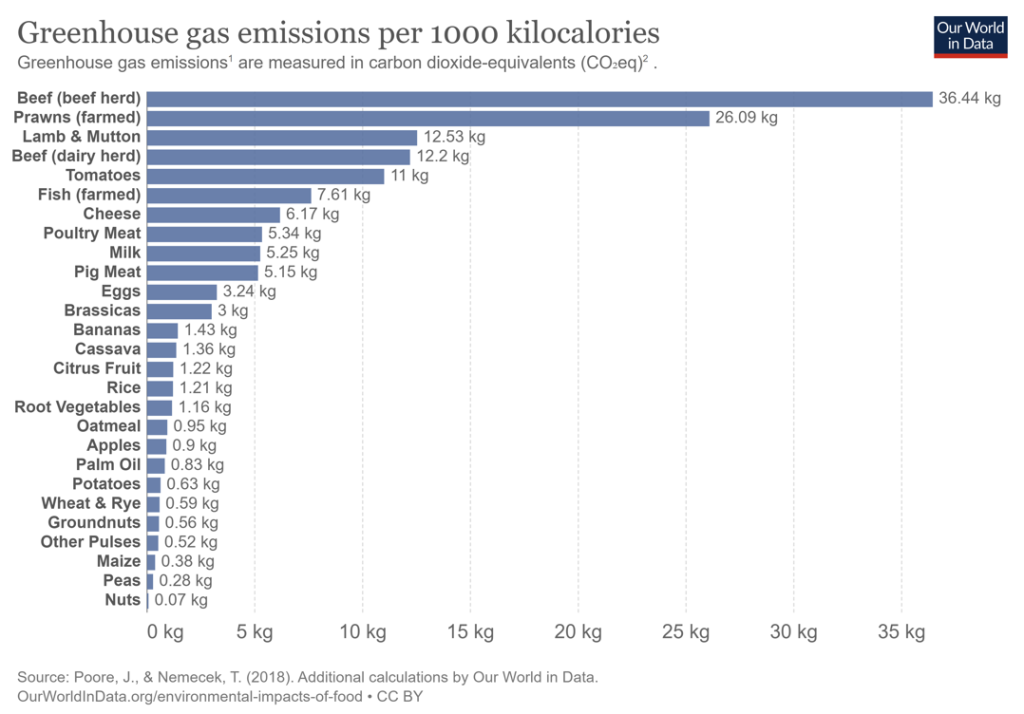
Lumped in with berries and grapes, blueberries are amongst the highest fruits on this list and still fairly high amongst food in general in terms of their carbon footprint.
- Blueberries have around 260 calories per pound compared to 400 calories per pound for bananas, meaning that they are going to be less carbon efficient when kilocalories are taken into account.
- Therefore, we can see that even when we compare blueberries across a wider range of foods, they still have a sizable carbon footprint.
How Can You Reduce and Offset Your Personal Carbon Footprint
There are many things you can do to cut down on how your blueberry consumption impacts the planet. By carefully considering your consumption habits to reduce carbon emissions and offsetting your carbon through carbon-extraction schemes, you can consume blueberries without having a large negative impact on the earth.
Some of the carbon risks of blueberries highlighted in this article may sound a bit alarming, especially since their carbon footprint is fairly high. However, the good news is that there are a lot of things you can do to lower your carbon emissions while still eating blueberries. Purchasing organic or locally grown blueberries and disposing of the waste efficiently can help with this. Furthermore, you can consider emission offsets, which work to extract carbon from the atmosphere. Here, we will walk you through how to accomplish both of these things.
How Can You Reduce Your Carbon Footprint When Shopping for Blueberries
Before you start worrying about your offsets, you might be wondering how you can stop producing carbon in the first place through your blueberry consumption. One of the best ways to do this is to look at the parts of the blueberry process that have the highest carbon footprint and start there. In this section, we give you a short list of ways you can reduce your blueberry carbon footprint, so you can continue consuming blueberries without the high carbon price tag.
- Buy blueberries seasonally: Although most blueberries are grown in the US, production slows during the winter and many distributors start relying more on South American imports. Therefore, your blueberry carbon footprint is going to be higher if you consume blueberries consistently all year round. However, if you make a point of only partaking during blueberry season, or simply during the warmer months, you will be reducing your impact.
- Choose cardboard packaging: If you are able to make the choice, cardboard packaging has a smaller carbon footprint than plastic packaging because it is easier to recycle. Therefore if you have the option, it is much better for your carbon footprint to choose the blueberries that come in cardboard rather than plastic containers.
- Don’t let blueberries go bad: Although blueberries don’t have any inedible parts that you have to throw out, they can go bad very easily and thus run the risk of being wasted. In order to avoid them ending up in landfills and producing methane, make sure you consume your blueberries as soon as you can after buying them.
- Buy organic blueberries: Pesticides are a major contributor to blueberries’ carbon footprint. If you buy blueberries from an organic farm, which don’t use chemicals like pesticides, then you will be reducing your blueberry carbon footprint.
Following some of these methods can really help you to cut down on your blueberry carbon emissions. None of these will bring your emissions down to zero, since there are always hidden carbon costs that may be outside of your control. But reduction is always better than nothing! However, if you do want to get your blueberry emissions down to absolute zero, then you can look into carbon offsets.
How Can You Offset Your Personal Carbon Footprint
Carbon offsets are reductions in carbon emissions that are used to compensate for carbon emissions occurring elsewhere – for example for the carbon emissions that are associated with blueberries.
They are measured in tons of CO2 equivalents and are bought and sold through international brokers, online retailers, and trading platforms on what is known as the global carbon offset market.
“Carbon Offset: a way for a company or person to reduce the level of carbon dioxide for which they are responsible by paying money to a company that works to reduce the total amount produced in the world, for example by planting trees”
Oxford Dictionary
In terms of blueberries – and indeed all food types – there will always be a carbon footprint, because of the resources it takes to get your food from farms to the place where you’ll eventually eat them. And while there are ways to reduce your carbon footprint when shopping for blueberries, carbon offsets would be a way to reduce your CO2e emissions all the way down to net zero (or even to become climate positive).
However, when you purchase carbon offsets, it’s important that they actually make a difference in offsetting (aka reducing) total carbon emissions. To achieve that, the following are key criteria:
- Carbon offset projects have to be effective (different projects have different effectiveness rates)
- Carbon offset projects have to be additional
- Carbon offset projects have to be permanent
- The claims from carbon offset projects have to be verifiable
To find the best carbon offsets for you personally, check out our full guide on the best carbon offsets for individuals, where you’ll also learn more about how these carbon offset projects work, what their respective offsetting costs are, and what your best way would be to offset your own carbon emissions.
Final Thoughts
Blueberries are an excellent treat, but their impact on the planet can be very high. However, there is a lot of variation in this climate impact that you may have control over. The distance you live from a blueberry farm, the type of packaging your blueberries come with, and whether or not you consume them before they go bad will all play a significant role in your blueberry carbon footprint. If you work towards conscious consumption, you will be able to consume blueberries with a greatly reduced carbon footprint!
Stay impactful,

Sources
- AGMRC: Blueberries
- WebMD: Health Benefits of Blueberries
- Britannica: Carbon footprint
- Science Direct: Life-cycle assessment (LCA)
- MIT SMR: Strategic Sustainability Uses of Life-Cycle Analysis
- Independent: Everything You Thought You Knew About the Carbon Footprint of Imported Food is Wrong
- California Grown: How Are Blueberries Grown?
- Canadian Science: Seasonal Growth Dynamics of the Wild Blueberry
- Home and Gardens: How to Grow Blueberries
- Harvesso: Blueberry Growing Guide
- Plantophiles: Blueberry Watering
- Hortidaily: World’s Top Ten Blueberry Producing Countries
- WRCC: Washington Climate
- Pesticide.org: Pesticides and the Climate Crisis.
- WSU: Harvesting Blueberries
- Blueberries Consulting: How Today’s Sizing and Packaging Solutions Help Blueberries
- TIS.GOV: Blueberries Transportation
- Consumer Ecology: Carbon Footprint of a Cardboard Box
- City to Sea: How Does Plastic Contribute to Climate Breakdown?
- Glacier Vehicles: How Much Fuel Does a Refrigerated Truck Consume?
- Wild Blueberries: How Much Food Are You Wasting?
- EPA: Reducing the Impact of Wasted Food
- BC: Food and Organic Waste
- Also Known As: 12 Interesting Facts About Packaging Waste
- Impactful Ninja: What is the Carbon Footprint of Avocados
- Helabel: Kiwis
- Impactful Ninja: What is the Carbon Footprint of Plums
- Impactful Ninja: What is the Carbon Footprint of Strawberries
- Impactful Ninja: What is the Carbon Footprint of Oranges
- Impactful Ninja: What is the Carbon Footprint of Apples
- Impactful Ninja: What is the Carbon Footprint of Pears
- Impactful Ninja; What is the Carbon Footprint of Bananas
- Impactful Ninja: What is the Carbon Footprint of Mangoes
- Impactful Ninja: What is the Carbon Footprint of Cherries
- Impactful Ninja: What is the Carbon Footprint of Peaches
- Impactful Ninja; What is the Carbon Footprint of Pineapples
- Impactful Ninja: What is the Carbon Footprint of Lemons
- Impactful Ninja; What is the Carbon Footprint of Clementines
- Impactful Ninja: What is the Carbon Footprint of Watermelons
- Our World in Data: Greenhouse Gas Emissions per 1000 kilocalories
- Blueberry.org: Seasonality
- Impactful Ninja: 12 Best Carbon Offsets for Individuals