What Is the Carbon Footprint of Cherries? A Life-Cycle Analysis


Impactful Ninja is reader-supported. When you buy through links on our site, we may earn an affiliate commission.
Learn more
Learn more
.
Hey fellow impactful ninja ? You may have noticed that Impactful Ninja is all about providing helpful information to make a positive impact on the world and society. And that we love to link back to where we found all the information for each of our posts. Most of these links are informational-based for you to check out their primary sources with one click. But some of these links are so-called "affiliate links" to products that we recommend. First and foremost, because we believe that they add value to you. For example, when we wrote a post about the environmental impact of long showers, we came across an EPA recommendation to use WaterSense showerheads. So we linked to where you can find them. Or, for many of our posts, we also link to our favorite books on that topic so that you can get a much more holistic overview than one single blog post could provide. And when there is an affiliate program for these products, we sign up for it. For example, as Amazon Associates, we earn from qualifying purchases. First, and most importantly, we still only recommend products that we believe add value for you. When you buy something through one of our affiliate links, we may earn a small commission - but at no additional costs to you. And when you buy something through a link that is not an affiliate link, we won’t receive any commission but we’ll still be happy to have helped you. When we find products that we believe add value to you and the seller has an affiliate program, we sign up for it. When you buy something through one of our affiliate links, we may earn a small commission (at no extra costs to you). And at this point in time, all money is reinvested in sharing the most helpful content with you. This includes all operating costs for running this site and the content creation itself. You may have noticed by the way Impactful Ninja is operated that money is not the driving factor behind it. It is a passion project of mine and I love to share helpful information with you to make a positive impact on the world and society. However, it's a project in that I invest a lot of time and also quite some money. Eventually, my dream is to one day turn this passion project into my full-time job and provide even more helpful information. But that's still a long time to go. Stay impactful,Affiliate Disclosure
Why do we add these product links?
What do these affiliate links mean for you?
What do these affiliate links mean for us?
What does this mean for me personally?
![]()
Cherries originate in Japan and are estimated to have a 2,000-year history. Today, they are farmed in countries all over the world from Turkey to the US. This fruit is a popular staple in pies and drinks. However, they also have an impact on the environment because many of the resources used to grow cherries produce significant carbon emissions. So, we had to ask: What is the carbon footprint of cherries?
The carbon footprint of cherries is moderate at 0.19kg (0.41 lb) of CO2e per pound of cherries. This is mainly due to their high pesticide use, lower-density farming, and significant plastic packaging. Their carbon footprint is medium to low compared to other fruits.
In this article, we will look at the full life-cycle of cherries, investigating how each stage contributes to their carbon footprint. We will go through all of the main stages of cherries’ production—starting with growth and then going through harvesting, processing, transportation, and ending at waste disposal—and will evaluate how each stage contributes to cherries’ carbon footprint. So, let’s get into the carbon footprint of cherries!
Here’s How We Assessed the Carbon Footprint of Cherries
The carbon footprint is one of the ways we measure the effects of our human-induced global climate change. It primarily focuses on the greenhouse gas (GHG) emissions associated with consumption, but also includes other emissions such as methane (CH4), nitrous oxide, and chlorofluorocarbons, and is generally expressed in carbon dioxide equivalents (CO2e).
“Carbon footprint: the amount of greenhouse gases and specifically carbon dioxide emitted by something (such as a person’s activities or a product’s manufacture and transport) during a given period”
Merriam Webster
Basically, it is the amount of carbon emitted by you as an individual or an organization providing you with goods and services – including cherries:
- This includes GHG emissions from producing the products that we use and foods that we eat (e.g., power plants, factories or farms, and landfills)
- GHG emissions from fuel that we burn directly or indirectly (e.g., logistics and transportation, cooling or heating facilities),
- as well as the GHG emissions attributed to how we consume these products and foods.
To understand the carbon footprint of cherries, we must assess their life-cycle and each stage’s sustainability. This life-cycle assessment (LCA) is a method to evaluate the environmental impacts of products and materials.
Here’s the Overall Carbon Footprint of Cherries
The overall carbon footprint of cherries is 0.19kg (0.41 lb) of CO2e per pound of cherries. This is mostly because of their use of plastic packaging, above-average amount of pesticides used, and lower-density orchards compared to many other fruits.
The carbon footprint of cherries is moderate to low when compared with other fruits. However, there are a few factors that impact this, including the distance and method of transportation, as well as the type of pesticides used.
| The carbon footprint of cherries | 0.19kg (0.41 lb) of CO2e per pound of cherries |
So, let’s have a look at each stage of the LCA of cherries!
| The life-cycle stages of cherries | Each stage’s carbon footprint |
| Growing of cherries | The carbon footprint of growing cherries is moderate. This is largely due to their low-density farming and high pesticide use. However, they fare very well in growth duration and irrigation needs. |
| Harvesting, processing, and packaging of cherries | The harvesting, processing, and packaging stage of cherry production has a high carbon footprint. This is mainly caused by the mechanical parts of their processing and the high amount of packaging that they require. |
| Transporting of cherries | The carbon footprint of transporting cherries is low, despite the fact that they are transported in refrigerated trucks. This is because most cherries are produced in the US so they don’t have far to travel. |
| End-of-life of cherries | The carbon footprint of the disposal of cherries is high because of the use of excessive plastic packaging and the low composting rates of their organic waste. |
As we can see from the table, processing and end-of-life are the two biggest contributors to cherries’ carbon footprint, with the growth stage and the transportation stage having minor impacts. These are the bigger summaries of each stage of cherries’ impact. But each of those categories has a more complex story to tell. In the ensuing sections, we will dive deeper into each aspect of cherries’ production process.
What Is the Carbon Footprint of Growing Cherries
The carbon footprint of growing cherries is moderate. This is largely due to their low-density farming and high pesticide use. However, they fare very well in growth duration and irrigation needs.
The process of growing cherries can have a relatively high carbon footprint, depending on the methods used. Factors like the amount of irrigation, deforestation, and pesticide use can all contribute to the overall impact of the growth stage.
Which factors impact the carbon footprint of growing cherries?
- How do cherries grow: Cherries grow on trees in orchards. This is good news for their carbon footprint because trees have natural carbon sequestering properties, which offsets much of the carbon created during the growth process. Thus, the method of cherry growth has an incredibly low impact on their carbon footprint.
- What is the growth duration of cherries: Cherry trees take 2–3 years to start producing fruit and 4–5 years before they are producing at their full potential. Individual cherries will take about 3–4 months to go from bloom to fruit, with blossoms usually arising in March and harvested in June. The longer these times are, the more resources the plant will need to yield fruit. Cherries have a fairly short maturing time, which means this part of the process does not contribute significantly to their carbon footprint.
- What is the land usage of cherries: An orchard of cherry trees can produce on average about 9.5 tons of cherries per hectare, which is equivalent to around 230 trees. This is on the lower end of fruit orchard densities, comparable to apple orchards (250 trees/hectare). However, it is far less than orange orchards (400 trees/hectare). Therefore, the land usage of cherries is significant and contributes moderately to their carbon footprint.
- What is the water usage of cherries: Cherry trees need about 3 inches of water a month, or about 35 inches a year. Much of the cherries consumed in the US are grown domestically, primarily in the Pacific Northwest. The average rainfall per year for the US as a whole is around 30 inches per year, and the Pacific Northwest is around 6–7 times that. So, most cherries produced in the US will either need very little irrigation or no irrigation at all. Therefore, this part of the growth process contributes minimally to cherries’ overall carbon footprint.
- What is the pesticide and fertilizer usage of cherries: Unfortunately, cherries are some of the worst offenders when it comes to pesticide use. Significant pesticide traces have been found on 91% of cherry surfaces. Since pesticides create a significant amount of carbon emissions, this stage does contribute significantly to cherries’ overall carbon footprint.
Cherries fare very well in the categories of growth method, growth duration, and irrigation, with all three of these categories contributing very minimally to their carbon footprint. However, their low-density orchards and significant pesticide use gives them an overall moderate carbon footprint at this stage.
In short, cherries have a moderate growth carbon footprint. It is raised by their high pesticide use and lower-density farming, but prevented from being too high by their lack of irrigation and short turnaround times.
What Is the Carbon Footprint of Harvesting, Processing, and Packaging Cherries
The harvesting, processing, and packaging stage of cherry production has a high carbon footprint. This is mainly caused by the mechanical parts of their processing and the high amount of packaging that they require.
The next major stage in the life-cycle of cherries’ carbon emissions is harvesting, processing, and packaging, which involves picking the fruit, checking it for damage, sorting it, and getting it ready for distribution. This stage can contribute greatly to the carbon footprint of the fruit.
Which factors impact the carbon footprint of harvesting, processing, and packaging cherries?
- How are cherries harvested: Cherries are exclusively picked by hand because they are extremely delicate. Since this part of the process does not require mechanized harvesting methods, its impact on cherries’ carbon footprint is very low.
- How are cherries processed: Cherries have a short shelf life, so they need to be cooled immediately after they are picked. This is done using a process called hydro cooling, which involves submerging the cherries in cold water. The water needs to be cooled using energy. Therefore, this part of the process contributes moderately to cherries’ carbon footprint. Cherries also go through both a mechanical and manual sorting process, which further contributes to their carbon footprint.
- How are cherries packaged: Cherries are a very delicate fruit, which means that they need heavy packaging. The most common types of cherry packaging are cardboard boxes, clamshell plastic tins, and plastic zip bags. Both cardboard and plastic create carbon emissions when they are produced. So, packaging does contribute significantly to cherries’ overall carbon footprint.
Cherries fare well in some aspects of the harvesting, processing, and packaging stage. For example, their manual picking method. However, given that there are still some mechanized and energy-consuming aspects of their processing and some fairly heavy packaging, their processing carbon footprint is fairly high overall.
In short, the use of a lot of packaging and high energy requirements in several aspects of the processes during this stage, means that cherries have a high harvesting, processing, and packaging carbon footprint.
What Is the Carbon Footprint of Transporting of Cherries
The carbon footprint of transporting cherries is low, despite the fact that they are transported in refrigerated trucks. This is because most cherries are produced in the US so they don’t have far to travel.
A cherry’s journey has just started when it is packaged. They then have to travel the distance between the farm and the grocery store. The distance, as well as the method through which they have to travel, are the two most important factors in determining the carbon footprint of their transportation.
Which factors impact the carbon footprint of transporting cherries?
- Where are cherries grown: Most of the US’s cherries are grown domestically. In fact, the US exports around $2.5 billion worth of cherries a year. Most US cherries are grown on the west coast, with California, Oregon, and Washington leading the cherry farming markets. For US consumers, this means that the transportation distances don’t contribute significantly to their cherry carbon footprints. However, the eastern half of the US is more populous than the western half, which means that the majority of Americans are still eating cherries transported thousands of miles across the country, which drives up their carbon footprint significantly.
- How are cherries transported: Cherries are transported in refrigerated trucks, which is very important due to their short shelf life. Refrigerated trucks use significantly more fuel than non-refrigerated trucks, which adds to cherries’ transportation carbon footprint.
Cherries are produced domestically in the US. So, their transportation carbon footprint is low. However, the use of refrigerated trucks and the fact that the majority of cherries are produced in less populous areas drives up the carbon footprint somewhat.
In short, cherry transportation does not have a significant carbon footprint, even though they require refrigeration during transit. This is because cherries have a shorter distance to travel than many other fruits.
What Is the Carbon Footprint of the End-of-Life of Cherries
The carbon footprint of the disposal of cherries is high because of the use of excessive plastic packaging and the low composting rates of their organic waste.
Cherries’ carbon footprint journey isn’t done after you consume them. In fact, one of the most important factors that will determine the overall carbon footprint of cherries is how its waste is disposed of. Here, we will look at how this stage in the process affects cherries’ carbon footprint.
Which factors impact the carbon footprint of the end-of-life of cherries?
- How are cherries disposed of: Cherries have pits and stems that can’t be eaten, but they can be composted. Unfortunately, only 4% of food is actually composted. This means that the majority of food waste ends up in landfills. Furthermore, throwing food waste in landfills generates methane, which is a very harmful greenhouse gas. Combine this with the fact that cherries have a short shelf life and are easily damaged, and you certainly have a lot of methane.
- How is the packaging of cherries disposed of: Cherries create both cardboard and plastic waste, which means that both of these things will need to be recycled. Cardboard has a remarkable recycling rate at 89%, whereas plastic has a low recycling rate, at around 9%. Because plastic is recycled so rarely, this stage also contributes significantly to cherries’ carbon footprint, despite the high recycling rates of cardboard.
Cherries leave behind a significant amount of waste. While all these forms of waste can technically be disposed of more sustainably, in practice only cardboard is recycled properly. Plastic recycling and organic waste almost always end up in landfills, meaning that this stage still has a high carbon footprint.
In short, the end-of-life stage of cherries has a significant carbon footprint. Plastic and organic waste that isn’t disposed of properly usually ends up in landfills, which increases cherries’ carbon footprint.
How Does the Carbon Footprint of Cherries Compare to Other Types of Food
Cherries rank fairly moderately compared to other foods on the carbon footprint scale. In terms of fruits, they are in the middle. Whereas when kilocalories are taken into account, they rank a little higher due to their lower calorie density. But overall, they are a moderate fruit when it comes to their carbon footprint.
When assessing the carbon footprint of a particular food, it is always important to place it in the context of other foods. This can help you to see the relative impact they have and assist you in making decisions between different foods based on their carbon footprint. In this next part of the article, we will show you how cherries compare to other foods in terms of carbon footprint.
How Does the Carbon Footprint of Cherries Compare to Other Types of Fruits
Fruits in general, tend to have lower carbon footprints than many other foods, like dairy products. However, there is still a lot of variation between them. Different transportation distances, the density of orchards, variations in growing methods, and pesticide use can all add up to contribute to their carbon footprints. Here, we will look at how cherries compare specifically to other fruits in terms of carbon footprint.
| Fruits | Carbon Footprint per lbs | Calories per lbs | Carbon Footprint per Calories |
| Avocados | 0.85 kg (1.9 lb) of CO2e per pound of avocados | 725 calories per pound | 1.17kg (2.57lb) of CO2e per 1,000 calories of avocados |
| Grapes | 0.64 kg (1.42 lbs) of CO2e per pound of grapes | 300 calories per pound | 2.13kg (4.7lb) of CO2e per 1,000 calories of grapes |
| Cantaloupes | 0.58kg (1.3lb) of CO2e per pound of cantaloupe | 154 calories per pound | 3.77kg (8.31lb) of CO2e per 1,000 calories of cantaloupes |
| Kiwis | 0.56kg (1.24lb) of CO2e per pound of kiwis | 277 calories per pound | 2.02kg (4.45lb) of CO2e per 1,000 calories of kiwis |
| Blueberries | 0.45kg (1lb) of CO2e per pound of blueberries | 256 calories per pound | 1.75kg (3.86lb) of CO2e per 1,000 calories of blueberries |
| Plums | 0.4 kg (0.88 lb) CO2e per pound of plums | 209 calories per pound | 1.91kg (4.21lb) of CO2e per 1,000 calories of plums |
| Strawberries | 0.39kg (0.88lb) of CO2e per pound of strawberries | 145 calories per pound | 2.69kg (5.93lb) of CO2e per 1,000 calories of strawberries |
| Pomegranates | 0.39kg (0.87lb) of CO2e per pound of pomegranates | 375 calories per pound | 1.04kg (2.29lb) of CO2e per pound of pomegranates |
| Figs | 0.3kg (0.68lb) of CO2e per pound of figs | 333 calories per pound | 0.9kg (1.98lb) of CO2e per 1,000 calories of figs |
| Papayas | 0.3kg (0.67lb) of CO2e per pound of papayas | 195 calories per pound | 1.54kg (3.4lb) of CO2e per 1,000 calories of papayas |
| Oranges | 0.3kg (0.66 lb) CO2e per pound of oranges | 213 calories per pound | 1.41kg (3.11lb) of CO2e per 1,000 calories of oranges |
| Dates | 0.27kg (0.6lb) of CO2e per pound of dates | 1,300 calories per pound | 0.21kg (0.46lb) of CO2e per 1,000 calories of dates |
| Apples | 0.24 kg (0.53 lb) of CO2e per pound of apples | 236 calories per pound | 1.02kg (2.25lb) of CO2e per 1,000 calories of apples |
| Pears | 0.23kg (0.52 lb) of CO2e per pound of pears | 259 calories per pound | 0.89kg (1.96lb) of CO2e per 1,000 calories of pears |
| Bananas | 0.21 kg (0.48 lb) of CO2e per pound of banana | 404 calories per pound | 0.52kg (1.15lb) of CO2e per 1,000 calories of bananas |
| Mangoes | 0.21 kg (0.46 lb) CO2e per pound of mangoes | 272 calories per pound | 0.77lb (1.7lb) of CO2e per 1,000 calories of mangoes |
| Cherries | 0.19kg (0.41 lb) of CO2e per pound of cherries | 227 calories per pound | 0.84kg (1.85lb) of CO2e per 1,000 calories of cherries |
| Limes | 0.18kg (0.39lb) of CO2e per pound of limes | 136 calories per pound | 1.32kg (2.91lb) of CO2e per 1,000 calories of limes |
| Peaches | 0.17kg (0.38lb) CO2e per pound of peaches | 176 calories per pound | 0.97kg (2.14lb) of CO2e per 1,000 calories of peaches |
| Apricots | 0.16kg (0.36lb) of CO2e per pound of apricots | 218 calories per pound | 0.73kg (1.61lb) of CO2e per 1,000 calories of apricots |
| Raspberries | 0.15kg (0.33lb) of CO2e per pound of raspberries | 240 calories per pound | 0.63kg (1.39lb) of CO2e per 1,000 calories of raspberries |
| Pineapples | 0.09 kg (0.20 lb) of CO2e per pound of pineapple | 227 calories per pound | 0.4kg (0.88lb) of CO2e per 1,000 calories of pineapples |
| Lemons | 0.09kg (0.19lb) CO2e per pound of lemons | 132 calories per pound | 0.68kg (1.5lb) of CO2e per 1,000 calories of lemons |
| Grapefruit | 0.08kg (0.18lb) of CO2e per pound of grapefruit | 191 calories per pound | 0.42kg (0.93lb) of CO2e per 1,000 calories of grapefruits |
| Blackberries | 0.07kg (0.15lb) of CO2e per pound of blackberries | 195 calories per pound | 0.36kg (0.79lb) of CO2e per 1,000 calories of blackberries |
| Clementines | 0.06 kg (0.13 lb) CO2e per pound of clementines | 213 calories per pound | 0.28kg (0.62kg) of CO2e per 1,000 calories of clementines |
| Watermelons | 0.05kg (0.11 lb) of CO2e per pound of watermelon | 136 calories per pound | 0.37kg (0.82lb) of CO2e per 1,000 calories of watermelons |
As we can see, cherries fall around the middle of these popular fruits when it comes to their carbon footprint. They are significantly more carbon-heavy than fruits like watermelons and clementines, which produce almost a quarter of the emissions of cherries. However, cherries still produce significantly less carbon than the top emitters, with about half the emissions of kiwis and plums. So overall, cherries have a moderate carbon footprint compared to other fruits.
How Does the Carbon Footprint of Cherries Compare to Other Types of Food in General
Branching outside the world of fruit, cherries also have a place among food in general. As a fruit, it is going to be on the lower end, but that doesn’t mean it is necessarily the lowest. Here, we will look at how cherries compare to the greater category of all foods.
When it comes to greenhouse gas emissions (GHG), foods are often compared in terms of emissions per 1,000 kilocalories (as opposed to their weight in lbs or kg).
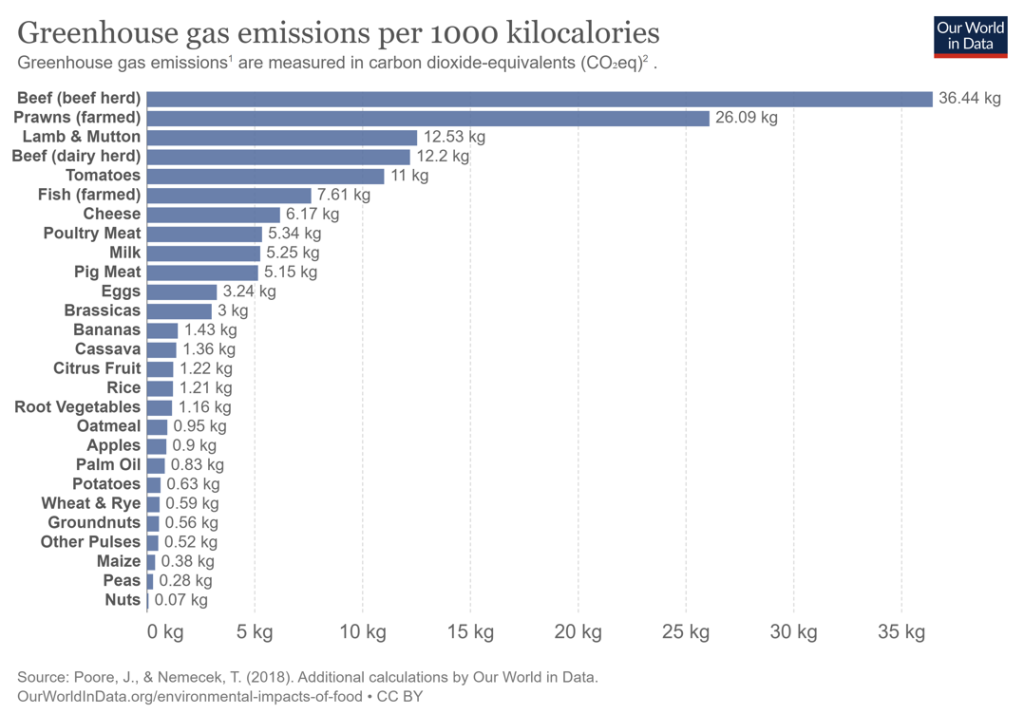
Cherries have a similar overall carbon footprint per pound to bananas.
- However, bananas have a significant amount of calories per pound (400),
- whereas cherries only have around 230 calories per pound.
- This means that bananas are more carbon efficient per calorie than cherries, which would put cherries significantly higher on the list.
- Thus, cherries have a significantly higher carbon footprint per 1,000 kilocalories than bananas.
How Can You Reduce and Offset Your Personal Carbon Footprint
There are many things you can do to cut down on how your cherry consumption impacts the planet. By carefully considering your consumption habits to reduce carbon emissions and offsetting your carbon through carbon-extraction schemes, you can consume cherries without having a large negative impact on the earth.
Some of the carbon risks of cherries highlighted in this article may sound a bit alarming. However, the good news is that there are a lot of things you can do to lower your carbon emissions while still eating cherries. Purchasing organic or locally grown cherries and disposing of the waste efficiently can help with this. Furthermore, you can consider emission offsets, which work to extract carbon from the atmosphere. Here, we will walk you through how to accomplish both of these things.
How Can You Reduce Your Carbon Footprint When Shopping for Cherries
Before you start worrying about your offsets, you might be wondering how you can stop producing carbon in the first place through your cherry consumption. One of the best ways to do this is to look at the parts of the cherry process that have the highest carbon footprint and start there. In this section, we will use this method to give you a short list of ways you can reduce your cherry carbon footprint, all so you can continue consuming cherries without the high carbon price tag.
- Buy domestic cherries: Although there are lots of cherries grown in the US today, importing cherries is on the rise. This means that you are increasingly more likely to come across imported cherries at the supermarket, with most of these imports coming from Chile. Imported cherries will obviously have a higher carbon footprint due to their longer transportation times. So, if you make sure that you buy cherries from the US, then you will have a lower cherry carbon footprint.
- Buy local cherries: The US is a big country, so even if you are buying US-grown cherries, they might still be shipping from across the continent. So if you want to keep your cherry consumption really low, you should look into the state where your cherries are being grown. In general, tart cherries are more common in Michigan, while sweet cherries are more common on the west coast. So, shopping by type might help you keep things more local. Short of this, there are also numerous small cherry farms all over the country, which you can purchase from to lower your carbon footprint further.
- Avoid plastic-packaged cherries: Many cherries come with plastic packaging. However, it is much better for your carbon footprint to choose cherries with cardboard packaging. Cardboard packaging is more widely recycled, and so less of it will end up in landfills. The less packaging that ends up in landfills, the lower your cherry carbon footprint will be. You may even be able to purchase cherries with no packaging at all, which is even better.
- Buy organic cherries: A major contributor to the carbon footprint of cherries is their pesticide use. Organic farms commit to avoiding chemicals like pesticides and thus have lower carbon emissions. Buying organic cherries will reduce your carbon footprint when it comes to pesticides.
- Compost your cherry waste: The low rates of food waste compost are a concern for cherries’ carbon footprint. So, committing to composting all your cherry waste will help to avoid this. If your municipality doesn’t have a composting system, you could try DIY composting in your backyard. It’s easy, effective, good for the planet, and can even take your garden to the next level!
Following some of these methods can really help you to cut down on your cherry carbon emissions. None of these will bring your emissions down to zero, since there are always hidden carbon costs that may be outside of your control. But reduction is always better than nothing! However, if you do want to get your cherry emissions down to absolute zero, then you can look into carbon offsets.
How Can You Offset Your Personal Carbon Footprint
Carbon offsets are reductions in carbon emissions that are used to compensate for carbon emissions occurring elsewhere – for example for the carbon emissions that are associated with cherries. They are measured in tons of CO2 equivalents and are bought and sold through international brokers, online retailers, and trading platforms on what is known as the global carbon offset market.
“Carbon Offset: a way for a company or person to reduce the level of carbon dioxide for which they are responsible by paying money to a company that works to reduce the total amount produced in the world, for example by planting trees”
Oxford Dictionary
In terms of cherries – and indeed all food types – there will always be a carbon footprint, because of the resources it takes to get your food from farms to the place where you’ll eventually eat them. And while there are ways to reduce your carbon footprint when shopping for cherries, carbon offsets would be a way to reduce your CO2e emissions all the way down to net zero (or even to become climate positive).
However, when you purchase carbon offsets, it’s important that they actually make a difference in offsetting (aka reducing) total carbon emissions. To achieve that, the following are key criteria:
- Carbon offset projects have to be effective (different projects have different effectiveness rates)
- Carbon offset projects have to be additional
- Carbon offset projects have to be permanent
- The claims from carbon offset projects have to be verifiable
To find the best carbon offsets for you personally, check out our full guide on the best carbon offsets for individuals, where you’ll also learn more about how these carbon offset projects work, what their respective offsetting costs are, and what your best way would be to offset your own carbon emissions.
Final Thoughts
Cherries are a great treat, as well as a versatile dessert ingredient. However, there are many aspects of their manufacturing process that have significant carbon footprints. Their growth process is very low in density and uses a high amount of pesticides. Additionally, they require a substantial amount of mechanization and packaging during the processing stage. Finally, their waste, both organic and packaging, mostly ends up in landfills.
On the other hand, they are primarily grown in the US and require very little irrigation. So, if you commit to buying locally grown, organic, and more sparsely-packaged cherries, you can enjoy them with a responsible carbon footprint.
Stay impactful,

Sources
- Harry and David: Cherry Facts
- World Atlas: The World Leaders in Cherry Production
- Britannica: Carbon footprint
- Science Direct: Life-cycle assessment (LCA)
- MIT SMR: Strategic Sustainability Uses of Life-Cycle Analysis
- PJOES: Carbon Footprint Assessment of Sweet Cherry Production
- The Produce Nerd: How Cherries are Grown
- USDA: Trees Are Climate Change Carbon Storage Heroes
- Chris Bowers: Cherries – Planting and Pruning
- Home Guides: When Does a Cherry Tree Grow Cherry Fruits?
- Wiki Farmer: Cherries Harvesting and Yield per Hectare
- Good Fruit: Big Cherries Require Big Commitment
- Ontario: Apple Rootstocks
- Wiki Farmer: Orange Tree Harvest and Yields
- Gardening Know How: Cherry Tree Irrigation Guide
- Cherry Festival: History of Cherries
- IBIS World: Average Annual Precipitation – United States.
- Down to Earth: The Dirty Dozen – Most Heavily Sprayed Foods
- Pesticide.org: Pesticides and the Climate Crisis
- Saveur: How Are Cherries Grown
- Calcherry: Cherry Facts
- Stemilt: How Cherries Get From Farm to Table
- Tree Fruit: Cherry Packing
- Consumer Ecology: Carbon Footprint of a Cardboard Box
- OECD: Plastic Leakage and Greenhouse Gas Emissions
- Tridge: Change of US Cherry Exports
- Earth Observatory NASA: United States Population Density
- Glacier Vehicles: Refrigerated Vans
- EPA: Reducing the Impact of Wasted Food
- GOV.BC: Organic Waste Management
- Also Known As: 12 Interesting Facts About Packaging Waste and Disposal
- Impactful Ninja: What is the Carbon Footprint of Avocados
- Helabel: Kiwis
- Impactful Ninja: What is the Carbon Footprint of Plums
- Impactful Ninja: What is the Carbon Footprint of Oranges
- Impactful Ninja: What is the Carbon Footprint of Apples
- Impactful Ninja: What is the Carbon Footprint of Peaches
- Impactful Ninja; What is the Carbon Footprint of Bananas
- Impactful Ninja: What is the Carbon Footprint of Mangoes
- Helabel: Strawberries
- Impactful Ninja; What is the Carbon Footprint of Pineapples
- Impactful Ninja: What is the Carbon Footprint of Lemons
- Impactful Ninja; What is the Carbon Footprint of Clementines
- Impactful Ninja: What is the Carbon Footprint of Watermelons
- Our World in Data: Greenhouse Gas Emissions per 1000 kilocalories
- USDA: Banana Nutrients
- USDA: Cherry Nutrients
- Fresh Fruit Portal: US Cherry Imports to Hit Record in 2022
- Tasting Table: Which State Produces the Most Cherries?
- Tasting Table: 15 Best Cherry Orchards in America
- Earth Easy: How to Make Compost Using Tumblers and Bins
- Impactful Ninja: 12 Best Carbon Offsets for Individuals