What Is the Carbon Footprint of Salad Mix? A Life-Cycle Analysis


Impactful Ninja is reader-supported. When you buy through links on our site, we may earn an affiliate commission.
Learn more
Learn more
.
Hey fellow impactful ninja ? You may have noticed that Impactful Ninja is all about providing helpful information to make a positive impact on the world and society. And that we love to link back to where we found all the information for each of our posts. Most of these links are informational-based for you to check out their primary sources with one click. But some of these links are so-called "affiliate links" to products that we recommend. First and foremost, because we believe that they add value to you. For example, when we wrote a post about the environmental impact of long showers, we came across an EPA recommendation to use WaterSense showerheads. So we linked to where you can find them. Or, for many of our posts, we also link to our favorite books on that topic so that you can get a much more holistic overview than one single blog post could provide. And when there is an affiliate program for these products, we sign up for it. For example, as Amazon Associates, we earn from qualifying purchases. First, and most importantly, we still only recommend products that we believe add value for you. When you buy something through one of our affiliate links, we may earn a small commission - but at no additional costs to you. And when you buy something through a link that is not an affiliate link, we won’t receive any commission but we’ll still be happy to have helped you. When we find products that we believe add value to you and the seller has an affiliate program, we sign up for it. When you buy something through one of our affiliate links, we may earn a small commission (at no extra costs to you). And at this point in time, all money is reinvested in sharing the most helpful content with you. This includes all operating costs for running this site and the content creation itself. You may have noticed by the way Impactful Ninja is operated that money is not the driving factor behind it. It is a passion project of mine and I love to share helpful information with you to make a positive impact on the world and society. However, it's a project in that I invest a lot of time and also quite some money. Eventually, my dream is to one day turn this passion project into my full-time job and provide even more helpful information. But that's still a long time to go. Stay impactful,Affiliate Disclosure
Why do we add these product links?
What do these affiliate links mean for you?
What do these affiliate links mean for us?
What does this mean for me personally?
![]()
There are hundreds of varieties of salad greens; from spinach, arugula, and kale, to lettuce and cress. They are high in nutrition, but low in calories. They are also rich in vitamins A, C, K, B, and potassium, making them a very healthy choice. Over 40% of consumers report having purchased a salad mix over the last twelve months. Yet, much less is shared about the environmental impact, and especially the carbon emissions of salad mix. So we had to ask: What is the carbon footprint of salad mix?
Salad mix has a carbon footprint of 0.41 kg (0.9 lbs) of CO2e per pound of produce, which is about average for vegetables. Over 70% of the carbon footprint is due to the harvesting, processing, and packaging required to produce salad mix. It has a higher carbon footprint than lettuce sold whole.
In this article, we’ll walk you through the overall carbon emissions of the life-cycle of salad mix. From growing and packaging, to transportation and end-of-life practices, you will learn how this vegetable affects the planet and discover some ways to reduce and offset the footprint.
Here’s How We Assessed the Carbon Footprint of Salad Mix
The carbon footprint is one of the ways we measure the effects of our human-induced global climate change. It primarily focuses on the greenhouse gas (GHG) emissions associated with consumption, but also includes other emissions such as methane (CH4), nitrous oxide, and chlorofluorocarbons, and is generally expressed in carbon dioxide equivalents (CO2e).
“Carbon footprint: the amount of greenhouse gases and specifically carbon dioxide emitted by something (such as a person’s activities or a product’s manufacture and transport) during a given period”
Merriam Webster
Basically, it is the amount of carbon emitted by you as an individual or an organization providing you with goods and services – including salad mix:
- This includes GHG emissions from producing the products that we use and foods that we eat (e.g., power plants, factories or farms, and landfills)
- GHG emissions from fuel that we burn directly or indirectly (e.g., logistics and transportation, cooling or heating facilities),
- as well as the GHG emissions attributed to how we consume these products and foods.
To understand the carbon footprint of salad mix, we must assess its life-cycle and each stage’s sustainability. This life-cycle assessment (LCA) is a method to evaluate the environmental impacts of products and materials.
Here’s the Overall Carbon Footprint of Salad Mix
The overall carbon footprint of salad mix is 0.41 kg (0.9 lbs) of CO2e per pound of produce, which is relatively high for crops. However, salad mix has a lower carbon footprint than other salad vegetables such as tomato, cucumber, and bell pepper.
American consumers purchase prepackaged salad mix twice as often as they buy heads of lettuce. So it is important to know the carbon footprint associated with this option. Then, you can make sustainable choices when it comes to your food.
| The carbon footprint of salad mix | 0.41 kg (0.9 lbs) of CO2e per pound of salad mix |
So, let’s have a look at each stage of the LCA of salad mix!
| The life-cycle stages of salad mix | Each stage’s carbon footprint |
| Growing of salad mix | The carbon footprint of growing salad mix is 0.09 kg (0.2 lbs) of CO2e per pound of produce, which makes up 17.27% of the overall carbon footprint. This is largely because of the land, water, and pesticide use in the agricultural stage of growing salad mix. |
| Harvesting, processing, and packaging of salad mix | The carbon footprint of harvesting, processing, and packaging salad mix is 0.32 kg (0.7 lbs) of CO2e per pound of produce, which makes up 70.73% of the overall carbon footprint. This large percentage is due to the use of plastic packaging, and the extensive processing and harvesting stages. |
| Transporting of salad mix | The carbon footprint of transporting salad mix is 0.05 kg (0.1 lbs) of CO2e per pound of produce, which makes up 12% of the overall carbon footprint of salad mix. Salad leaves are grown in the US, mainly in California and Arizona. The carbon footprint is impacted by transport methods, and food miles, so buying locally reduces the carbon footprint of this stage. |
| End-of-life of salad mix | The carbon footprint of the end-of-life of processing salad mix is largely impacted by the amount of food wasted. Salad is one of the most wasted foods, with around 40% of salad mix bags being thrown away. Salad mix makes up 12.6% of all wasted salad, with 37,400 tons being wasted a year. Plastic packaging is bad for the environment, but lengthens the shelf-life, leading to less food waste. |
These four stages can be broken down in more detail to understand why the carbon footprint of salad mix is relatively high in comparison to other vegetables.
What Is the Carbon Footprint of Growing Salad Mix
The carbon footprint of growing salad mix is 0.09 kg (0.2 lbs) of CO2e per pound of produce, which makes up 17.27% of the overall carbon footprint. This is largely because of the land, water, and pesticide use in the agricultural stage of growing salad mix.
Since there are so many varieties of leafy greens that can be included in salad mixes, the overall carbon footprint can be difficult to quantify. However, by looking at an overall mix of leaves such as lettuce, spinach, and kale, we can explore what the carbon footprint of salad mix is.
Which factors impact the carbon footprint of growing salad mix?
- How does salad mix grow: Salad leaves are grown above ground in rows. They can be grown either in fields, greenhouses, or vertically. Technological advancements in sustainable greenhouses and vertical farming means that the growing process is becoming less carbon-intensive. Some salad leaves, such as lettuce and arugula, are grown hydroponically, relying on water without needing to grow in soil.
- What is the growth duration of salad mix: Most salad greens are fast-growing, and can be ready to harvest within 3-6 weeks. Less resources have to be used on crops with short growth durations. Salad leaves are one of the fastest-growing vegetables, so their growth carbon footprint is fairly low.
- What is the land usage of salad mix: Salad can be incredibly land efficient, and is one of the most commonly grown crops on vertical farms. Vertical farming uses 10-20 times less land, making it far more carbon efficient than traditional farming. However, in non-vertical farms, salad leaves have to be planted with space between each crop. Around 20-30 tons of spinach are grown per hectare in fields or greenhouses, which makes it a land-efficient crop. For comparison, cucumbers yield 15 tons per hectare on average.
- What is the water usage of salad mix: A lot of salad leaves, like lettuce, are shallow-rooted and require a lot of water. This makes a negative impact on the carbon footprint. However, vertical farming of lettuce uses 90% less water than traditional farms, lowering the carbon footprint of salad mix.
- What is the pesticide and fertilizer usage of salad mix: Salad mix leaves are some of the worst offenders for pesticide use. The Environmental Working Group found that non-organic spinach had more pesticide residues by weight than all other produce tested, and that 60% of kale plants were contaminated with residue of a pesticide considered a carcinogen. While this is a risk for health reasons, it also increases the carbon footprint, since pesticides produce carbon emissions through manufacturing, transportation, and application to crops.
In short, salad mix is more water and land efficient if grown vertically. Since it is a fast-growing crop, it is less labor-intensive, but the use of pesticides increases the carbon footprint of salad mix.
What Is the Carbon Footprint of Harvesting, Processing, and Packaging Salad Mix
The carbon footprint of harvesting, processing, and packaging salad mix is 0.32 kg (0.7 lbs) of CO2e per pound of produce, which makes up 70.73% of the overall carbon footprint. This large percentage is due to the use of plastic packaging, and the extensive processing and harvesting stages.
Most salad leaves are harvested, processed, and packaged by machine. This increases the carbon footprint, making the carbon footprint higher than buying whole heads of lettuce.
Which factors impact the carbon footprint of harvesting, processing, and packaging salad mix?
- How is salad mix harvested: Salad mixes are generally harvested by machine, which mow the leaves into large bins. This process is far more labor- and time-efficient than hand-harvesting. However, these tractors have negative impacts on soil health and release a lot of carbon emissions, increasing the carbon footprint of salad mix.
- How is salad mix processed: Salad mixes go through an extensive processing stage. First, a variety of salad leaves are mixed together evenly on conveyor lines, then sorted for quality, and washed three times with sanitized water. They are then dried and moved to the packaging stage. This level of processing has a large impact on the carbon footprint of this product, due to the machines and processing plants, which require vast amounts of energy and release carbon emissions.
- How is salad mix packaged: Salad mixes are automatically packed into polyethylene bags, and then packed into boxes and shipped in pallets. It is incredibly difficult to buy plastic-free salad mixes, so the use of plastic packaging enormously impacts the overall carbon footprint of salad mix.
In short, there is a reliance on machine harvesting and processing, as well as extensive plastic packaging used for shipping salad mixes. This contributes the vast majority of carbon emissions towards the overall carbon footprint of salad mix.
What Is the Carbon Footprint of Transporting of Salad Mix
The carbon footprint of transporting salad mix is 0.05 kg (0.1 lbs) of CO2e per pound of produce, which makes up 12% of the overall carbon footprint of salad mix. Salad leaves are grown in the US, mainly in California and Arizona. The carbon footprint is impacted by transport methods, and food miles, so buying locally reduces the carbon footprint of this stage.
Salad mixes are generally grown in California, and shipped in refrigerated trucks across the country. This creates carbon emissions, but this can be reduced through more regional methods of growing, such as vertical farming.
Which factors impact the carbon footprint of transporting salad mix?
- Where is salad mix grown: Over 90% of lettuce is grown in California and Arizona, with California growing from April to October, and Arizona growing from November to March. Other leafy greens, like kale, grow in California during the colder months. In warmer months, locally grown salad leaves can be found across the US. This reduces food miles and is better for the environment.
- How is salad mix transported: Bagged salad is usually on supermarket shelves within 48 hours of being picked, because salad leaves are very quick to degrade. Because of this, all salad mixes must be transported in refrigerated vehicles. These vehicles can emit up to 29 times more potentially carcinogenic particulate matter and six times more nitrogen oxides than far larger, modern diesel truck engines. If salad mixes are bought from local farms, the carbon footprint is decreased.
In short, salad mixes are relatively easy to grow locally, decreasing food miles and carbon emissions. In summer months, buying salad mix seasonally from local farms will create the smallest carbon footprint. With the advancements of vertical farming, salad mixes could be grown even more locally, reducing the carbon footprint even further.
What Is the Carbon Footprint of the End-of-Life of Salad Mix
The carbon footprint of the end-of-life of processing salad mix is largely impacted by the amount of food wasted. Salad is one of the most wasted foods, with around 40% of salad mix bags being thrown away. Salad mix makes up 12.6% of all wasted salad, with 37,400 tons being wasted a year. The plastic packaging is bad for the environment, but lengthens the shelf-life, leading to less food waste.
Salad mix degrades very quickly, not usually lasting more than 7-10 days. Because of this, it is one of the most wasted foods. Salad mix is compostable, but often ends up in landfill. The packaging is often recyclable, but can also end up in landfill if not disposed of properly.
Which factors impact the carbon footprint of the end-of-life of salad mix?
- How is salad mix disposed of: 37,400 tons of avoidable mixed salad waste is discarded every year. They are compostable, however, food waste in landfill is a big problem for the environment. 16% of all food is wasted on farms, largely for aesthetic reasons. The resources used to grow these crops just to discard them are enormous, and negatively impact the carbon footprint of mixed salad. Salad mix has a shelf life of about a week, but this can be extended by storing leaves in Tupperware, drying them in a salad spinner, and reviving them in ice water.
- How is the packaging of salad mix disposed of: Plastic packaging can be difficult to recycle. However, many of the polyethylene bags used for packaging are recyclable, as long as the polyethylene is not bonded with other plastics. This is because polyethylene is generally only recycled to make like-for-like products. Still, it is much more sustainable to buy loose produce. A lot of plastic that we recycle ends up on the other side of the world, causing a threat to developing countries. So, it is not as good for the environment as we may imagine. Since salad mix is rarely sold loose, this increases the carbon footprint.
In short, salad mix is often wasted due to a short shelf-life, and is almost always packaged in plastic. To reduce waste, be conscious of using the entire bag of salad mix, and recycling any plastic waste.
How Does the Carbon Footprint of Salad Mix Compare to Other Types of Food
Salad mix has a relatively high carbon footprint compared to other vegetables. However, vegetables tend to produce far fewer carbon emissions than other types of food.
Let’s see how mixed salad compares with other vegetables.
How Does the Carbon Footprint of Salad Mix Compare to Other Types of Vegetables
In comparison to other vegetables, the carbon footprint of salad mix is quite average. For example, it produces less than half of the carbon emissions that cucumber produces. However, salad vegetables need more resources to grow, making their carbon footprint higher than root vegetables.
So, salad mixes are one of the more sustainable salad vegetables, but how do they compare to other types of food?
How Does the Carbon Footprint of Salad Mix Compare to Other Types of Food in General
Like brassicas, mixed salad is one of the more sustainable options in comparison to other types of food. It produces around twelve times less greenhouse gas emissions than beef.
When it comes to greenhouse gas emissions (GHG), foods are often compared in terms of emissions per 1,000 kilocalories (as opposed to their weight in lbs or kg).
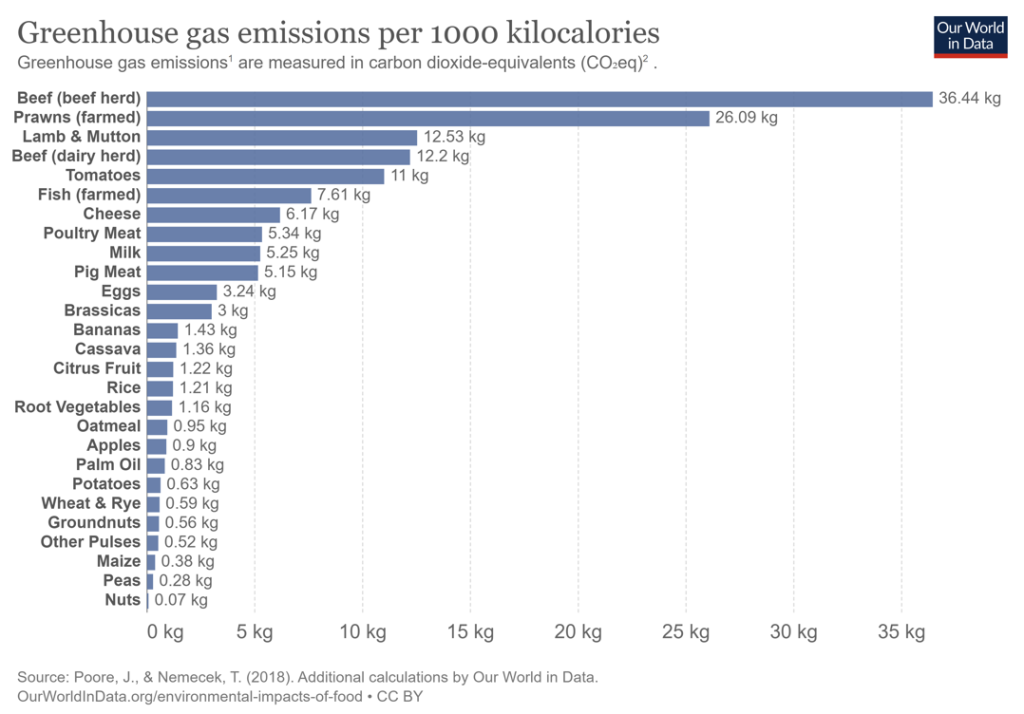
However, since mixed salad is extremely low in calories, a far greater amount of produce is needed to equal 1,000 kilocalories.
- To eat 1,000 kilocalories, you would need to consume 66 servings, or around 18 full heads of lettuce, or 232 ounces.
- In comparison to beef you would only need 4.6 servings to eat 1,000 kilocalories, or 16 ounces.
- Comparatively, salad vegetables have an extremely high carbon footprint per kilocalorie, but are enormously less calorific than animal-based food.
- More calorific plant-based foods, such as pulses and nuts, have a minuscule carbon footprint in comparison to animal-based proteins. A single portion of beef amounts to around 14 portions of mixed salad, in terms of calories.
- This means that per portion, you will be consuming fewer calories, and so the carbon footprint will not be as large as this graph suggests.
Even though the carbon emissions for salad mix are low in comparison to other types of food, try to be mindful of the ways you can lessen your environmental impact when you purchase it.
How Can You Reduce and Offset Your Personal Carbon Footprint
All of the food you eat will have some form of carbon footprint, even when you buy foods with relatively average CO2e, such as salad mix. However, there are ways to offset and reduce your personal carbon footprint.
There are a few easy techniques to buy more eco-friendly mixed salad, and you can also find ways to offset the carbon footprint after your purchase.
How Can You Reduce Your Carbon Footprint When Shopping for Salad Mix
When shopping for mixed salad, consider these ways to lessen your impact on the environment.
- Shop locally and seasonally: Salad mix is in season from April to October. Buying from local farms reduces the carbon emissions produced and makes it a much more sustainable choice.
- Choose organic: Organic salad mix produces a much lower carbon footprint than non-organic vegetables, due to the lack of pesticide production, distribution, and the overall higher health of soil for crops, insects, and animals.
- Avoid waste: Salad mix often ends up going bad in the refrigerator. Avoid this by storing your salad correctly, and consuming it quickly. Salad leaves that are looking a bit wilted can sometimes be revived after a soak in iced water.
Taking these actions are a great way to lessen your own carbon footprint, but there are also ways to offset the impact of consuming mixed salad as well.
How Can You Offset Your Personal Carbon Footprint
Carbon offsets are reductions in carbon emissions that are used to compensate for carbon emissions occurring elsewhere – for example for the carbon emissions that are associated with salad mix. They are measured in tons of CO2 equivalents and are bought and sold through international brokers, online retailers, and trading platforms on what is known as the global carbon offset market.
“Carbon Offset: a way for a company or person to reduce the level of carbon dioxide for which they are responsible by paying money to a company that works to reduce the total amount produced in the world, for example by planting trees”
Oxford Dictionary
In terms of salad mix – and indeed all food types – there will always be a carbon footprint, because of the resources it takes to get your food from farms to the place where you’ll eventually eat them. And while there are ways to reduce your carbon footprint when shopping for salad mix, carbon offsets would be a way to reduce your CO2e emissions all the way down to net zero (or even to become climate positive).
However, when you purchase carbon offsets, it’s important that they actually make a difference in offsetting (aka reducing) total carbon emissions. To achieve that, the following are key criteria:
- Carbon offset projects have to be effective (different projects have different effectiveness rates)
- Carbon offset projects have to be additional
- Carbon offset projects have to be permanent
- The claims from carbon offset projects have to be verifiable
To find the best carbon offsets for you personally, check out our full guide on the best carbon offsets for individuals, where you’ll also learn more about how these carbon offset projects work, what their respective offsetting costs are, and what your best way would be to offset your own carbon emissions.
Final Thoughts
Salad mix has a relatively low carbon footprint in comparison to other food, but an average carbon footprint when compared with other vegetables. Try to reduce your carbon footprint by eating organic, reducing food waste, and purchasing local, seasonal produce. As vertical farming becomes a more viable source for the production of salad mix, the growing process will have a lower carbon footprint, and be more localized. When you do enjoy salad mix, think about whether you can offset the carbon emissions created, to make this healthy snack a more sustainable option!
Stay impactful,

Sources
- Harvard Health Publishing: Salad greens: Getting the most bang for the bite
- The Packer: Packaged salad growers reinvent and refine the category, despite challenges
- Britannica: Carbon footprint
- Science Direct: Life-cycle assessment (LCA)
- MIT SMR: Strategic Sustainability Uses of Life-Cycle Analysis
- Carbon Cloud: Leaf Spinach
- Impactful Ninja: What Is the Carbon Footprint of Tomatoes
- Impactful Ninja: What Is the Carbon Footprint of Cucumbers
- Impactful Ninja: What Is the Carbon Footprint of Bell Peppers
- P.L. Light Systems: P. L. Light Systems Expert Articles: Pros and Cons of Growing Leafy Greens in a Vertical Farm
- Forbes: Growing Leafy Greens In Massive, Sustainable Greenhouses
- Healthy Food: How do they produce salad greens?
- Grow Veg: Quick Maturing Plants: 5 Fast Growing Vegetables to Try
- Farming Connect: Vertical Farming: A new future for food production?
- WikiFarmer: How to Grow Spinach – From Seeding to Harvesting
- Haifa: Crop Guide: Growing Cucumbers
- Oregon State University: Some vegetables require less water than others
- WUSF: Growing lettuce in a vertical farm uses drastically less water. Is it a solution for a hotter climate
- Environmental Working Group: Spinach is packed with nutrients – but also EU-banned pesticides
- Environmental Working Group: More than half of kale samples tainted by possibly cancer-causing pesticide
- The Produce Nerd: How Salad Mixes are Created
- Farms Wise: Are Tractors Bad for the Environment?
- Meili Robots: Vertical Farming: A Step Towards the Green Cities of the Future
- Agricultural Marketing Resource Centre: Commodity Profile: Lettuce
- Lettuce Info: Where is My Lettuce From?
- The ACR Journal: Refrigerated vehicles contribute to thousands of deaths and costs across EU
- The Guardian: Salad days soon over: consumers throw away 40% of bagged leaves
- WRAP: The Food We Waste
- World Wildlife Fund: Fight climate change by preventing food waste
- World Wildlife Fund: What farmers found when they measured fresh produce left in the field
- Edie: Wonky fruit & veg: turning an environmental problem into a social solution
- Let’s Recycle: Supermarkets to take back plastic film in-store
- Sesotec: Recycling more packaging –potential for PE and PP
- Live Science: The Plastic We ‘Recycle’ Is Actually Horrible for the Environment
- Impactful Ninja: What Is the Carbon Footprint of Broccoli
- Our World in Data: Greenhouse Gas Emissions per 1000 kilocalories
- Nutritionix: Calories in 100g of Iceberg Lettuce
- Healthline: Beef 101: Nutrition Facts and Health Effects
- Columbia Climate School: Is Organic Food Really Better for the Environment?
- Real Simple: 5 Ways to Keep Bagged Salad Fresh for as Long as Possible
- Impactful Ninja: 12 Best Carbon Offsets for Individuals