What Is the Carbon Footprint of Pears? A Life-Cycle Analysis


Impactful Ninja is reader-supported. When you buy through links on our site, we may earn an affiliate commission.
Learn more
Learn more
.
Hey fellow impactful ninja ? You may have noticed that Impactful Ninja is all about providing helpful information to make a positive impact on the world and society. And that we love to link back to where we found all the information for each of our posts. Most of these links are informational-based for you to check out their primary sources with one click. But some of these links are so-called "affiliate links" to products that we recommend. First and foremost, because we believe that they add value to you. For example, when we wrote a post about the environmental impact of long showers, we came across an EPA recommendation to use WaterSense showerheads. So we linked to where you can find them. Or, for many of our posts, we also link to our favorite books on that topic so that you can get a much more holistic overview than one single blog post could provide. And when there is an affiliate program for these products, we sign up for it. For example, as Amazon Associates, we earn from qualifying purchases. First, and most importantly, we still only recommend products that we believe add value for you. When you buy something through one of our affiliate links, we may earn a small commission - but at no additional costs to you. And when you buy something through a link that is not an affiliate link, we won’t receive any commission but we’ll still be happy to have helped you. When we find products that we believe add value to you and the seller has an affiliate program, we sign up for it. When you buy something through one of our affiliate links, we may earn a small commission (at no extra costs to you). And at this point in time, all money is reinvested in sharing the most helpful content with you. This includes all operating costs for running this site and the content creation itself. You may have noticed by the way Impactful Ninja is operated that money is not the driving factor behind it. It is a passion project of mine and I love to share helpful information with you to make a positive impact on the world and society. However, it's a project in that I invest a lot of time and also quite some money. Eventually, my dream is to one day turn this passion project into my full-time job and provide even more helpful information. But that's still a long time to go. Stay impactful,Affiliate Disclosure
Why do we add these product links?
What do these affiliate links mean for you?
What do these affiliate links mean for us?
What does this mean for me personally?
![]()
In an average year, over 25,000 tons of pears are consumed globally, making them an immensely popular fruit. They can be used in anything from elegant French pastries (Tarte Bourdaloue anyone?) to delicious juices. But there are also aspects of the pear production process that might be harmful to the planet. Many components from growing pears to delivering them to your supermarket can accrue a high carbon footprint. So, we had to ask: What is the carbon footprint of pears?
Pears have a moderate carbon footprint of 0.23kg (0.52 lbs) of CO2e per pound of pears. This is mainly due to their high pesticide use, mechanized processing, intensive packaging needs, and poor recycling rates. Their carbon footprint is average compared to other fruits.
In this article, we will look at the full life-cycle of pears, investigating how each stage contributes to their carbon footprint. We will go through all of the main stages of pears’ production—starting with growth and then going through harvesting, processing, transportation, and ending at waste disposal—and will evaluate how each stage contributes to pears’ carbon footprint. So, let’s get into the carbon footprint of pears!
Here’s How We Assessed the Carbon Footprint of Pears
The carbon footprint is one of the ways we measure the effects of our human-induced global climate change. It primarily focuses on the greenhouse gas (GHG) emissions associated with consumption, but also includes other emissions such as methane (CH4), nitrous oxide, and chlorofluorocarbons, and is generally expressed in carbon dioxide equivalents (CO2e).
“Carbon footprint: the amount of greenhouse gases and specifically carbon dioxide emitted by something (such as a person’s activities or a product’s manufacture and transport) during a given period”
Merriam Webster
Basically, it is the amount of carbon emitted by you as an individual or an organization providing you with goods and services – including pears:
- This includes GHG emissions from producing the products that we use and foods that we eat (e.g., power plants, factories or farms, and landfills)
- GHG emissions from fuel that we burn directly or indirectly (e.g., logistics and transportation, cooling or heating facilities),
- as well as the GHG emissions attributed to how we consume these products and foods.
To understand the carbon footprint of pears, we must assess their life-cycle and each stage’s sustainability. This life-cycle assessment (LCA) is a method to evaluate the environmental impacts of products and materials.
Here’s the Overall Carbon Footprint of Pears
The overall carbon footprint of pears is 0.23kg (0.52 lbs) of CO2e per pound of pears. The main factors that contribute to this carbon footprint are pesticides, packaging and packaging disposal, mechanization, and refrigeration.
The carbon footprint of pears is moderate when compared with other fruits. However, there are a few factors that impact this, including the distance and method of transportation, as well as the type of pesticides used.
| The carbon footprint of pears | 0.23kg (0.52 lbs) of CO2e per pound of pears |
So, let’s have a look at each stage of the LCA of pears!
| The life-cycle stages of pears | Each stage’s carbon footprint |
| Growing of pears | The growth stage of pears has a very low carbon footprint. This is because of their low land requirements to grow, and the carbon-sequestering properties of pear trees. However, their excessive use of pesticides prevents them from being carbon-neutral at this stage. |
| Harvesting, processing, and packaging of pears | The carbon footprint of harvesting, processing, and packaging pears is moderate. This is mainly due to the amount of packaging used and their mechanized processing methods. |
| Transporting of pears | The carbon footprint of transporting pears is low to moderate. Their domestic production brings the footprint down, however, the refrigeration required during transport releases a significant amount of carbon emissions which increases the overall footprint. |
| End-of-life of pears | The end-of-life carbon footprint of pears is moderate to high. This is mainly because of the low composting rates for organic waste. Pears also require heavy packaging with styrofoam and cardboard. Styrofoam in particular has a very low recycling rate which drives up the carbon footprint of this stage. |
As we can see from the table, processing and end-of-life are the two biggest contributors to pears’ carbon footprint, with the growth stage and the transportation stage having minor impacts. These are the bigger summaries of each stage of pears’ impact. But each of those categories has a more complex story to tell. In the ensuing sections, we will dive deeper into each aspect of pears’ production process.
What Is the Carbon Footprint of Growing Pears
The end-of-life carbon footprint of pears is moderate to high. This is mainly because of the low composting rates for organic waste and low composting rates for styrofoam packaging, though cardboard recycling rates are high.
The process of growing pears generally has a very low carbon footprint, depending on the methods used. Factors like the amount of irrigation, deforestation, and pesticide use can all contribute to the overall impact of the growth stage.
Which factors impact the carbon footprint of growing pears?
- How do pears grow: Pears grow on trees in orchards. This is good news for their carbon footprint because trees have natural carbon-sequestering properties. Thus, this part of the pear growing process has a very low carbon footprint.
- What is the growth duration of pears: The longer the growth frame, the higher the carbon footprint because more resources are required to sustain the plants. Pear trees take about 3 years before they start producing fruit and around 5-7 years before they are producing at their full capacity. In terms of individual pears, they take 3-5 months to go from bloom to fruit. Pears’ time frames are fairly average, meaning that this part of the growth process doesn’t contribute too significantly to pears’ overall carbon footprint.
- What is the land usage of pears: When fruits use less land, they require less deforestation and resources to sustain them. Pear orchards can generally yield 40-50 tons of pears per hectare. When you compare that to only 9.5 tons per hectare for cherries, pears exhibit an extremely economical use of space. This means that this stage does not contribute significantly to their carbon footprint.
- What is the water usage of pears: Pears require about 52 inches of water a year or one inch of water per week. Most pears grow in the Pacific Northwest US, which mostly has high rainfall averages. For example, Oregon, a top pear-growing state, gets around 75–90 inches of water per year. So, they require no carbon-heavy irrigation. Therefore, this stage of the process does not contribute significantly to the overall carbon footprint of pears.
- What is the pesticide and fertilizer usage of pears: Pears were found to have significant pesticides on at least 75% of samples. This is considerably more than other tree fruits. Pesticides create a significant amount of emissions, so this stage does contribute to the overall carbon footprint.
The growing stage of pears has a low carbon footprint overall. The only major source of carbon emissions are their significant use of pesticides. But otherwise, growing pears is a low-carbon component of their overall production process.
In short, pears have a very small growth carbon footprint. Besides the high pesticide use, almost every part of the process is low-emissions.
What Is the Carbon Footprint of Harvesting, Processing, and Packaging Pears
The carbon footprint of harvesting, processing, and packaging pears is moderate. This is mainly due to the amount of packaging used and their mechanized processing methods.
The next major stage in the life-cycle of pears’ carbon emissions is harvesting, processing, and packaging. This involves picking the fruit, checking it for damage, sorting it, and getting it ready for distribution. This stage can contribute greatly to the carbon footprint of the fruit depending on the processes used.
Which factors impact the carbon footprint of harvesting, processing, and packaging pears?
- How are pears harvested: Generally, pears are harvested by hand because their delicate skin cannot handle shake and catch machines. Therefore, the process of harvesting pears is very carbon efficient.
- How are pears processed: Pears are sorted and processed mechanically, in a gentle assembly line so as not to harm the skin. They are also chilled immediately to help with shelf life. This part of the process uses energy and therefore contributes significantly to pears’ overall carbon footprint.
- How are pears packaged: Pears are often packaged in sectioned cardboard boxes, sometimes with individual styrofoam pockets around each pear, to keep them safe. Both cardboard and styrofoam create carbon emissions during their production process and so this stage contributes significantly to pears’ overall carbon footprint.
Pears are harvested by hand, which can go a long way towards saving on carbon emission. However, they have a mechanical processing method and use a lot of packaging during their production process. Because of these factors, this stage’s carbon footprint is moderate to high.
In short, pears have a considerable processing carbon footprint.They are harvested by hand, but their processing methods are mechanized and their packaging levels are very high.
What Is the Carbon Footprint of Transporting of Pears
The carbon footprint of transporting pears is low to moderate. Their domestic production brings the footprint down, however, the refrigeration required during transport releases a significant amount of carbon emissions which increases the overall footprint.
Pears’ journeys have just started when they are packaged. They then have to travel the distance between the farm and the grocery store. The distance, as well as the method through which they have to travel, are the two most important factors in determining the carbon footprint of their transportation.
Which factors impact the carbon footprint of transporting pears?
- Where are pears grown: Most pears consumed in the US are grown in California, Oregon, and Washington. This is very good news for their carbon footprint because it means that they have a much smaller distance to travel than fruits from other continents. However, it is still important to bear in mind that the US is a very large country and most of the population lives in the Eastern half. Thus, many Americans will still be eating pears that have traveled thousands of miles. So, your pear’s carbon footprint largely depends on where in the country you live.
- How are pears transported: Pears are transported in refrigerated trucks. Unfortunately, refrigerated trucks use considerably more fuel than unrefrigerated trucks, meaning that this stage does contribute significantly to pears’ carbon footprint.
Being a domestic fruit, pears have a fairly low transportation footprint. However, there are still several things that can drive it up, like transporting them across the country or using refrigerated trucks, which is still very common in pear transportation.
In short, transporting pears has a fairly low carbon footprint. The fact that they are produced in the US, although mainly in the less-populated part of the country, helps their case. However, the use of refrigerated trucks does come at a carbon cost.
What Is the Carbon Footprint of the End-of-Life of Pears
The end-of-life carbon footprint of pears is moderate to high. This is mainly because of the low composting rates for organic waste. Pears also require heavy packaging with styrofoam and cardboard. Styrofoam in particular has a very low recycling rate which drives up the carbon footprint of this stage.
Pears’ carbon footprint journey isn’t done after you consume them. In fact, one of the most important factors that will determine the overall carbon footprint of pears is how its waste is disposed of. Here, we will look at how this stage in the process affects pears’ carbon footprint.
Which factors impact the carbon footprint of the end-of-life of pears?
- How are pears disposed of: Pears have cores that cannot be eaten. They can theoretically be recycled, but in practice, only 4% of food waste is actually composted. Furthermore, food waste is particularly harmful to the environment as it releases a greenhouse gas called methane when it is put in landfills. This means that organic waste contributes significantly to pears’ overall carbon footprint.
- How is the packaging of pears disposed of: The two components of pear packaging—cardboard and styrofoam—have very different waste disposal methods. Cardboard is very widely recycled, with a staggering 89% recycling rate, whereas styrofoam is incredibly difficult to recycle, with a less than 1% recycling rate.
In general, pear waste—both organic and packaging—is generally not disposed of very well. With the exception of cardboard recycling, most of its waste ends up in landfills with very low recycling and composting rates. This drives up the carbon footprint of this stage.
In short, pear waste does not need to end up in landfills, but in practice it does. Styrofoam and organic waste are the main culprits that drive up pears’ carbon footprint.
How Does the Carbon Footprint of Pears Compare to Other Types of Food
Pears rank in the middle to top half of foods and fruits, in terms of carbon footprint. When kilocalories are taken into account, their lower calorie/pound ration means that their carbon footprint is significantly higher.
Pears have a medium to high carbon footprint in relation to other foods. When assessing the carbon footprint of a particular food, it is always important to place it in the context of other foods. This can help you to see the relative impact they have and assist you in making decisions between different foods based on their carbon footprint. In this next part of the article, we will show you how pears compare to other foods in terms of carbon footprint.
How Does the Carbon Footprint of Pears Compare to Other Types of Fruits
Pears have a moderately high carbon footprint when compared to other fruits. Fruits in general, tend to have lower carbon footprints than many other foods, like dairy products. However, there is still a lot of variation between them. Different transportation distances, the density of orchards, variations in growing methods, and pesticide use can all add up to contribute to their carbon footprints. Here, we will look at how pears compare specifically to other fruits in terms of carbon footprint.
| Fruits | Carbon Footprint per lbs | Calories per lbs | Carbon Footprint per Calories |
| Avocados | 0.85 kg (1.9 lb) of CO2e per pound of avocados | 725 calories per pound | 1.17kg (2.57lb) of CO2e per 1,000 calories of avocados |
| Grapes | 0.64 kg (1.42 lbs) of CO2e per pound of grapes | 300 calories per pound | 2.13kg (4.7lb) of CO2e per 1,000 calories of grapes |
| Cantaloupes | 0.58kg (1.3lb) of CO2e per pound of cantaloupe | 154 calories per pound | 3.77kg (8.31lb) of CO2e per 1,000 calories of cantaloupes |
| Kiwis | 0.56kg (1.24lb) of CO2e per pound of kiwis | 277 calories per pound | 2.02kg (4.45lb) of CO2e per 1,000 calories of kiwis |
| Blueberries | 0.45kg (1lb) of CO2e per pound of blueberries | 256 calories per pound | 1.75kg (3.86lb) of CO2e per 1,000 calories of blueberries |
| Plums | 0.4 kg (0.88 lb) CO2e per pound of plums | 209 calories per pound | 1.91kg (4.21lb) of CO2e per 1,000 calories of plums |
| Strawberries | 0.39kg (0.88lb) of CO2e per pound of strawberries | 145 calories per pound | 2.69kg (5.93lb) of CO2e per 1,000 calories of strawberries |
| Pomegranates | 0.39kg (0.87lb) of CO2e per pound of pomegranates | 375 calories per pound | 1.04kg (2.29lb) of CO2e per pound of pomegranates |
| Figs | 0.3kg (0.68lb) of CO2e per pound of figs | 333 calories per pound | 0.9kg (1.98lb) of CO2e per 1,000 calories of figs |
| Papayas | 0.3kg (0.67lb) of CO2e per pound of papayas | 195 calories per pound | 1.54kg (3.4lb) of CO2e per 1,000 calories of papayas |
| Oranges | 0.3kg (0.66 lb) CO2e per pound of oranges | 213 calories per pound | 1.41kg (3.11lb) of CO2e per 1,000 calories of oranges |
| Dates | 0.27kg (0.6lb) of CO2e per pound of dates | 1,300 calories per pound | 0.21kg (0.46lb) of CO2e per 1,000 calories of dates |
| Apples | 0.24 kg (0.53 lb) of CO2e per pound of apples | 236 calories per pound | 1.02kg (2.25lb) of CO2e per 1,000 calories of apples |
| Pears | 0.23kg (0.52 lb) of CO2e per pound of pears | 259 calories per pound | 0.89kg (1.96lb) of CO2e per 1,000 calories of pears |
| Bananas | 0.21 kg (0.48 lb) of CO2e per pound of banana | 404 calories per pound | 0.52kg (1.15lb) of CO2e per 1,000 calories of bananas |
| Mangoes | 0.21 kg (0.46 lb) CO2e per pound of mangoes | 272 calories per pound | 0.77lb (1.7lb) of CO2e per 1,000 calories of mangoes |
| Cherries | 0.19kg (0.41 lb) of CO2e per pound of cherries | 227 calories per pound | 0.84kg (1.85lb) of CO2e per 1,000 calories of cherries |
| Limes | 0.18kg (0.39lb) of CO2e per pound of limes | 136 calories per pound | 1.32kg (2.91lb) of CO2e per 1,000 calories of limes |
| Peaches | 0.17kg (0.38lb) CO2e per pound of peaches | 176 calories per pound | 0.97kg (2.14lb) of CO2e per 1,000 calories of peaches |
| Apricots | 0.16kg (0.36lb) of CO2e per pound of apricots | 218 calories per pound | 0.73kg (1.61lb) of CO2e per 1,000 calories of apricots |
| Raspberries | 0.15kg (0.33lb) of CO2e per pound of raspberries | 240 calories per pound | 0.63kg (1.39lb) of CO2e per 1,000 calories of raspberries |
| Pineapples | 0.09 kg (0.20 lb) of CO2e per pound of pineapple | 227 calories per pound | 0.4kg (0.88lb) of CO2e per 1,000 calories of pineapples |
| Lemons | 0.09kg (0.19lb) CO2e per pound of lemons | 132 calories per pound | 0.68kg (1.5lb) of CO2e per 1,000 calories of lemons |
| Grapefruit | 0.08kg (0.18lb) of CO2e per pound of grapefruit | 191 calories per pound | 0.42kg (0.93lb) of CO2e per 1,000 calories of grapefruits |
| Blackberries | 0.07kg (0.15lb) of CO2e per pound of blackberries | 195 calories per pound | 0.36kg (0.79lb) of CO2e per 1,000 calories of blackberries |
| Clementines | 0.06 kg (0.13 lb) CO2e per pound of clementines | 213 calories per pound | 0.28kg (0.62kg) of CO2e per 1,000 calories of clementines |
| Watermelons | 0.05kg (0.11 lb) of CO2e per pound of watermelon | 136 calories per pound | 0.37kg (0.82lb) of CO2e per 1,000 calories of watermelons |
As we can see from this chart, pears rank in the top half of fruits when it comes to their carbon footprint. They have double the carbon footprint of fruits like lemons, pineapples, and strawberries, and four times the carbon footprint of clementines and watermelons. Though, they are still well below the worst offenders, having ¼ of the emissions of avocados and ½ the emissions of kiwis and plums. They sit between the median (0.21) and the average (0.24) emissions, which means their carbon footprint is moderate compared to other fruits.
How Does the Carbon Footprint of Pears Compare to Other Types of Food in General
Branching outside the world of fruit, pears also have a place among food in general. In terms of their carbon footprint in relation to kilocalories, they have a moderate to high carbon footprint compared to other foods.
When it comes to greenhouse gas emissions (GHG), foods are often compared in terms of emissions per 1,000 kilocalories (as opposed to their weight in lbs or kg).
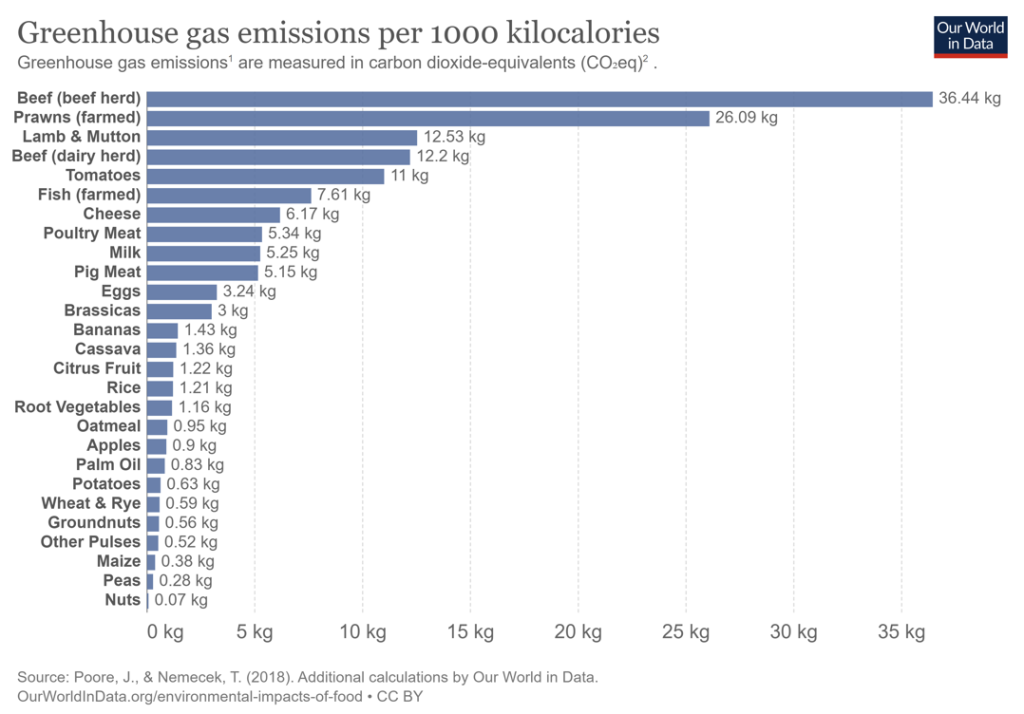
Since pears have a similar overall carbon footprint to bananas, we can place them in a similar place on this chart.
- However, when kilocalories are taken into account, they start to diverge.
- Bananas have around 400 calories per pound, whereas pears have around 260, meaning that bananas are more calorie efficient.
- Thus, pears would be ranked significantly higher on this chart where kilocalories are taken into account.
- For this reason, pears’ carbon footprint in relation to foods, in general, is fairly high.
How Can You Reduce and Offset Your Personal Carbon Footprint
There are many things you can do to cut down on how your pear consumption impacts the planet. By carefully considering your consumption habits to reduce carbon emissions and offsetting your carbon through carbon-extraction schemes, you can consume pear without having a large negative impact on the earth.
Some of the carbon risks of pears highlighted in this article may sound a bit alarming, especially since their carbon footprint is fairly high. However, the good news is that there are a lot of things you can do to lower your carbon emissions while still eating pears. Purchasing organic or locally grown pears and disposing of the waste efficiently can help with this. Furthermore, you can consider emission offsets, which work to extract carbon from the atmosphere. Here, we will walk you through how to accomplish both of these things.
How Can You Reduce Your Carbon Footprint When Shopping for Pears
Before you start worrying about your offsets, you might be wondering how you can stop producing carbon in the first place through your pear consumption. One of the best ways to do this is to look at the parts of the pear process that have the highest carbon footprint and start there. In this section, we give you a short list of ways you can reduce your pear carbon footprint, so you can continue consuming pears without the high carbon price tag.
- Purchase organic pears: As we saw in the growth section, one of the biggest contributors to pears’ carbon footprint is their excessive pesticide use. Organic farms commit to using no chemicals, including pesticides. So, you will be able to greatly reduce your pear emissions by supporting these farms instead.
- Purchase local pears: Although pears are mainly produced in the US, there are still a lot of regions in the country that will need them to be transported significant distances. If you live on the west coast, this will be fairly easy for you. But if you live on the east coast, it’s a good idea to try to find some local pear farms to reduce travel times.
- Dispose of organic and packaging waste responsibly: Much of the waste produced by pears ends up in landfills. The good news is that you have significant control over that as the consumer. Try to compost any organic waste that you can. If your city doesn’t have a composting system, you can try creating your own! Likewise, make sure to recycle any plastic and attempt to recycle styrofoam, if possible. Taking these measures will mean that far less of your pear waste will end up in landfills and thus your emissions will be reduced.
- Avoid styrofoam: One of the biggest issues with pear waste is how difficult it is to recycle styrofoam. Buying pears that are loose or in cardboard only will help reduce that harmful styrofoam waste. Often, pears from places like farmer’s markets will have less packaging.
Following some of these methods can really help you to cut down on your pear carbon emissions. None of these will bring your emissions down to zero, since there are always hidden carbon costs that may be outside of your control. But reduction is always better than nothing! However, if you do want to get your pear emissions down to absolute zero, then you can look into carbon offsets.
How Can You Offset Your Personal Carbon Footprint
Carbon offsets are reductions in carbon emissions that are used to compensate for carbon emissions occurring elsewhere – for example for the carbon emissions that are associated with pears. They are measured in tons of CO2 equivalents and are bought and sold through international brokers, online retailers, and trading platforms on what is known as the global carbon offset market.
“Carbon Offset: a way for a company or person to reduce the level of carbon dioxide for which they are responsible by paying money to a company that works to reduce the total amount produced in the world, for example by planting trees”
Oxford Dictionary
In terms of pears – and indeed all food types – there will always be a carbon footprint, because of the resources it takes to get your food from farms to the place where you’ll eventually eat them. And while there are ways to reduce your carbon footprint when shopping for pears, carbon offsets would be a way to reduce your CO2e emissions all the way down to net zero (or even to become climate positive).
However, when you purchase carbon offsets, it’s important that they actually make a difference in offsetting (aka reducing) total carbon emissions. To achieve that, the following are key criteria:
- Carbon offset projects have to be effective (different projects have different effectiveness rates)
- Carbon offset projects have to be additional
- Carbon offset projects have to be permanent
- The claims from carbon offset projects have to be verifiable
To find the best carbon offsets for you personally, check out our full guide on the best carbon offsets for individuals, where you’ll also learn more about how these carbon offset projects work, what their respective offsetting costs are, and what your best way would be to offset your own carbon emissions.
Final Thoughts
Pears are a great snack, but as we have seen, their emissions can be significant. Purchasing local, organic produce is the best way to lower your carbon emissions while still eating pears. However, waste is still a big issue, especially when it comes to their high packaging needs and styrofoam usage. So, take control of your own waste disposal methods to ensure you do not contribute more emissions to the already significant carbon footprint of pears.
Sources
- Indexbox: Which Country Consumes the Most Pears in the World
- Meilleur du Chef: Tart Bourdaloue
- Britannica: Carbon footprint
- Science Direct: Life-cycle assessment (LCA)
- MIT SMR: Strategic Sustainability Uses of Life-Cycle Analysis
- LiveLCA: Pears
- USA Pears: Orchard to Market: The Journey of a Pear
- USDA: Trees are Climate Change Carbon Storage Heroes
- Home Guides: How Long Does it Take to Grow Pears?
- Agrifarming: Pears
- Impactful Ninja: What is the Carbon Footprint of Cherries
- Garden Boss: How Much Water Do Pears Need?
- GOV: Pear Nutrition
- WRCC: Oregon Climate
- EWG: The Dirty Dozen
- Pesticide.org: Pesticides and the Climate Crisis
- Calpear: Study on Mechanical Mass-Harvesting of Pears
- Omafra: Recommendation for Harvest and Storage of Pears
- Tree Fruit: Pear Packaging
- NCBI: Extension of Shelf Life of Pear Fruits
- Consumer Ecology: Carbon Footprint of a Cardboard Box
- Teorra: What is the Carbon Footprint of Styrofoam Packaging?
- NASA: United States Population Density
- TIS: Pear Transport Information
- Glacier Vehicles: How Much Fuel Does a Refrigerated Truck Use?
- EPA: Reducing the Impact of Wasted Food
- GOV: Waste Management
- Also Known As: 12 Interesting Facts About Packaging
- Insider: Is Styrofoam Recyclable?
- Impactful Ninja: What is the Carbon Footprint of Avocados
- Helabel: Kiwis
- Impactful Ninja: What is the Carbon Footprint of Plums
- Impactful Ninja: What is the Carbon Footprint of Oranges
- Impactful Ninja: What is the Carbon Footprint of Apples
- Impactful Ninja: What is the Carbon Footprint of Peaches
- Impactful Ninja; What is the Carbon Footprint of Bananas
- Impactful Ninja: What is the Carbon Footprint of Mangoes
- Helabel: Strawberries
- Impactful Ninja; What is the Carbon Footprint of Pineapples
- Impactful Ninja: What is the Carbon Footprint of Lemons
- Impactful Ninja; What is the Carbon Footprint of Clementines
- Impactful Ninja: What is the Carbon Footprint of Watermelons
- Our World in Data: Greenhouse Gas Emissions per 1000 kilocalories
- USDA: Bananas
- USDA: Pears
- Earth Easy: Composting
- Impactful Ninja: 12 Best Carbon Offsets for Individuals